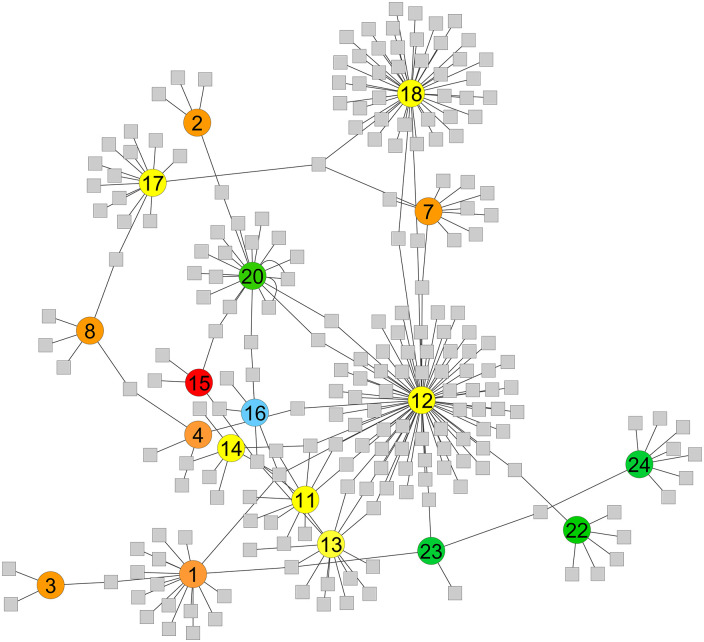
Figure 6.
Network analysis of BC studies distribution based on detected volatiles. The number in the circles represents the number of the study, allotted similarly in Table 1; grey squares represent the number of significant altered VOCs. Different colours represent different matrices; yellow: urine, orange: breath, red: tissue, green: cell media, and blue: saliva. Studies that had no VOC connection with any other study were left out of the network.

