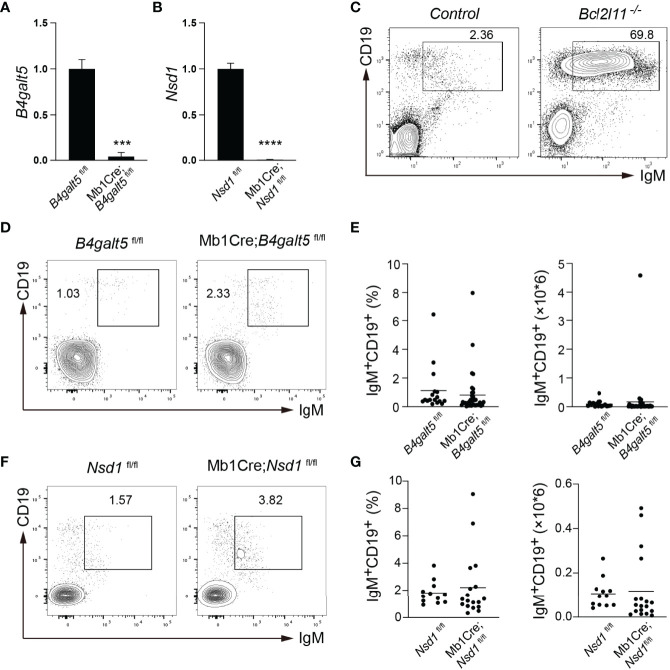
Figure 5.
In vivo validation in IgMb-macroself mice with bone marrow cells from conditional knockout mice. (A, B) Expression levels of B4galt5 (A) and Nsd1 (B) in splenic B cells from Mb1Cre;B4galt5fl/fl and Mb1Cre;Nsd1fl/fl mice analyzed by qRT-PCR. Bar graph shows mean + SD. Data are representative of 2 independent experiments using technical triplicates. (C) Representative flow cytometry plots analyzing splenocytes from IgMb-macroself mice reconstituted with bone marrow cells from C57BL/6J mice and Bcl2l11-/- mice at terminal analysis. Numbers adjacent to outlined areas indicate percentage of IgM+CD19+ B cells among splenocytes. (D) Representative flow cytometry plots analyzing splenocytes from IgMb-macroself mice reconstituted with bone marrow cells from B4galt5fl/fl and Mb1Cre;B4galt5fl/fl mice at terminal analysis. Numbers adjacent to outlined areas indicate percentage of IgM+CD19+ B cells among splenocytes. (E) Graphs summarizing percentages and numbers of IgM+CD19+ splenic B cells of mice analyzed in (D). (F) Representative flow cytometry analysis of splenocytes from IgMb-macroself mice reconstituted with bone marrow cells from Nsd1fl/fl and Mb1Cre;Nsdfl/fl mice at terminal analysis, with numbers adjacent to outlined areas indicating percentage of IgM+CD19+ B cells among splenocytes. (G) Graphs summarizing percentages and numbers of IgM+CD19+ splenic B cells of mice analyzed in (D). Data in (E) and (G) are pooled from 3 and 2 independent experiments, respectively with n=17 for B4galt5fl/fl, n=41 for Mb1Cre;B4galt5fl/fl, n=12 for Nsd1fl/fl, and n=18 for Mb1Cre;Nsd1fl/fl mice. Data in (C) are adapted from (20). Statistical analysis was performed with an unpaired two-tailed Student’s T-test with ***P < 0.001 and ****P < 0.0001. No statistically significant differences were found in (D, F).

