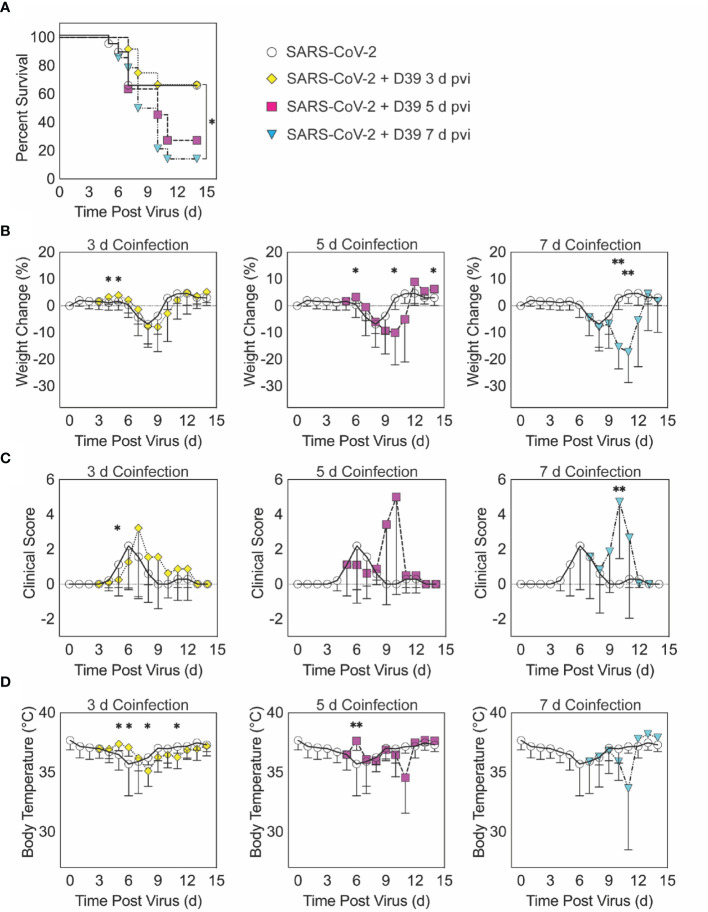
Figure 1.
SARS-CoV-2-pneumococcal coinfection in K18-hACE2 mice. Kaplan-Meier survival curves (A), percent weight loss (B), cumulative clinical score (C), and temperature (D) of mice infected with SARS-CoV-2 (250 PFU; white circles, solid lines) followed by 103 CFU D39 at 3 d (yellow diamonds, dotted lines), 5 d (magenta squares, dashed lines), or 7 d (cyan triangles, dash-dotted lines) pvi. Data are shown as the mean ± standard deviation (SD) and significant differences are indicated by *,P < 0.05; **,P < 0.01 for comparisons between SARS-CoV-2 infection and SARS-CoV-2-pneumococcal coinfection.

