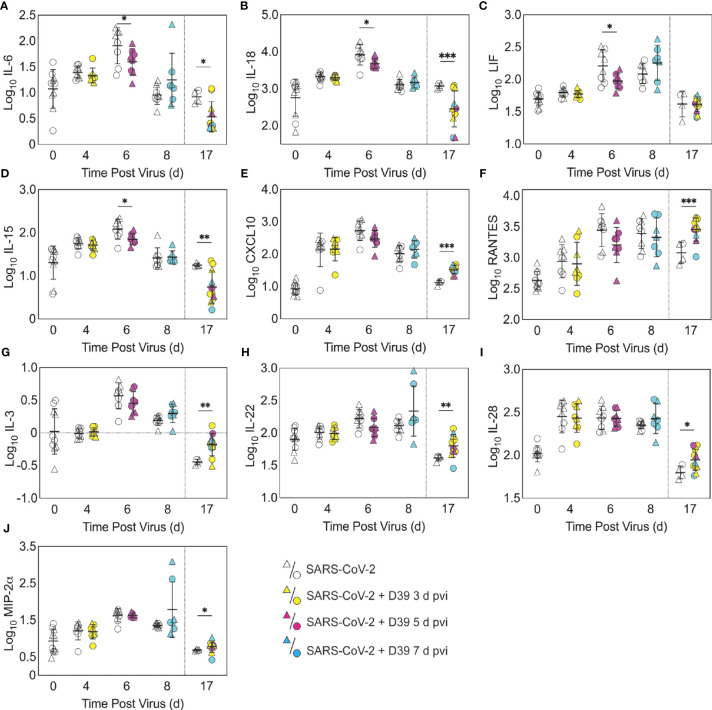
Figure 4.
Pulmonary cytokines and chemokines during SARS-CoV-2 infection and SARS-CoV-2-pneumococcal coinfection. Total IL-6 (A), IL-18 (B), LIF (C), IL-15 (D), CXCL10 (E), RANTES (F), IL-3 (G), IL-22 (H), IL-28 (I), and MIP-2α (J) in the lungs of female (circles) and male (triangle) mice infected with SARS-CoV-2 (250 PFU; white) followed by infection with 103 CFU D39 at 3 d (yellow), 5 d (magenta), or 7 d (cyan) pvi. Each symbol represents a single mouse and the mean ± standard deviation (SD) are for combined male and female groups. Significant differences are indicated by *,P < 0.05; **,P < 0.01; ***,P < 0.001 for comparisons between indicated groups. Plots depicting additional cytokine and chemokine quantities (absolute log10 picograms) are in Figure S5 and a heatmap representing the normalized quantity (average log2 change over naïve) is in Figures S6.

