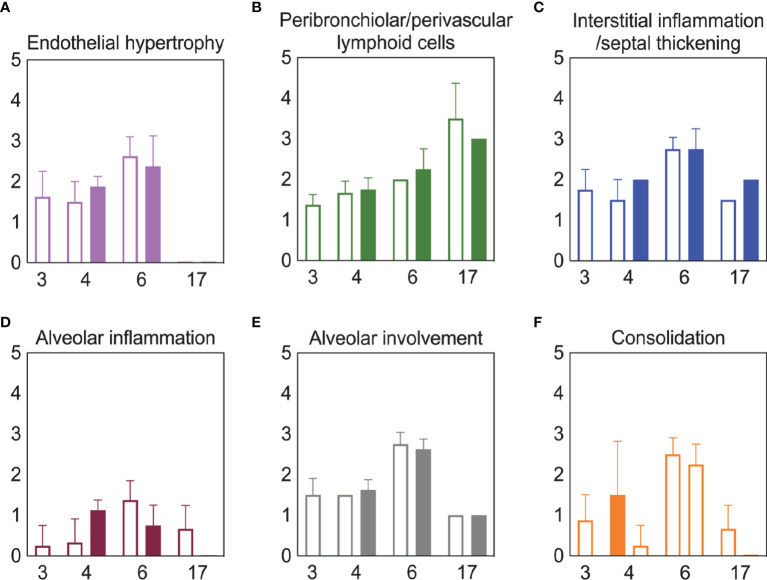
Figure 5.
Lung pathology during SARS-CoV-2 infection and pneumococcal coinfection. Average endothelial hypertrophy (A), peribronchiolar/perivascular lymphoid cells (B), interstitial inflammation/septal thickening (C), alveolar inflammation (D), extent of alveolar involvement (E), and consolidation (F) in lungs of mice infected with SARS-CoV-2 (250 PFU; open bars) followed by 103 CFU D39 at 3 or 5 d pvi (filled bars). Plots represent the mean ± standard deviation (SD) bars for combined male and female groups.

