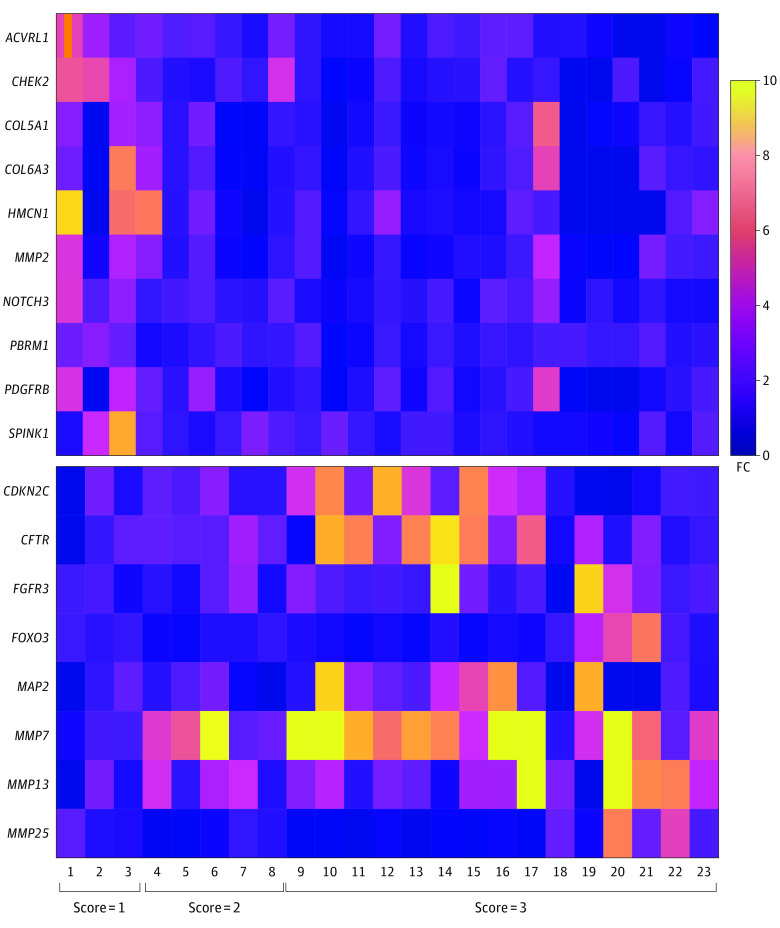
Figure 2. Heat Map of the Dysregulated Genes From Fine-Needle Aspiration Biopsy Specimens by RNA Sequencing Heat Map of Genes With Protein Overexpression or Underexpression on RNA Sequencing.
The heat map represents the 10 most highly expressed (top) and the 8 least expressed (bottom) signals on RNA sequencing of frozen fine-needle aspiration biopsy specimens from the 23 patients in the discovery cohort. Scores indicate association with pathologic response: 1 = marked response, 2 = partial response, and 3 = poor or no response. FC indicates fold change.

