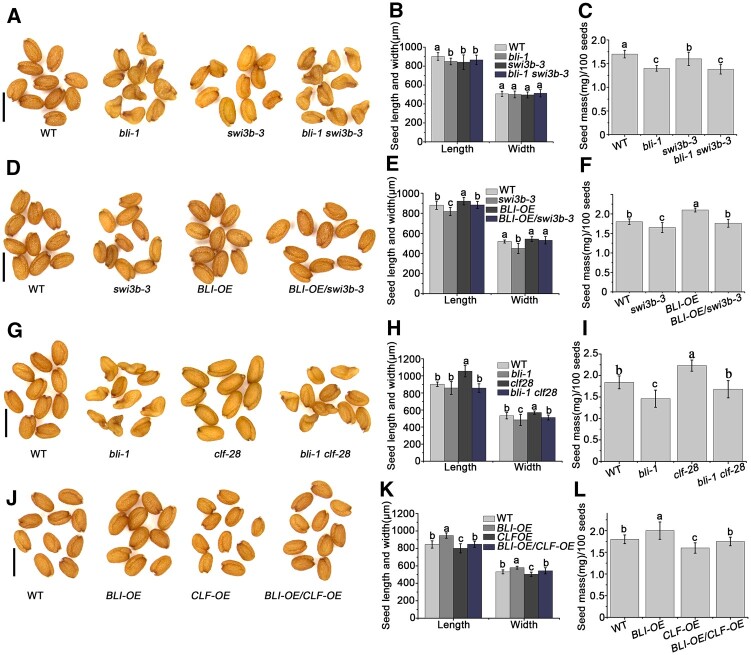
Figure 9.
The genetic relationship between BLI and SWI3B or CLF in regulating seed maturation. A, Mature seed phenotypes of WT, bli-1, swi3b-3, and bli-1 swi3b-3 plants determined by microscopy. Bars = 1 mm. B, Seed size (length and width) of WT, bli-1, swi3b-3, and bli-1 swi3b-3. C, Seed mass of WT, bli-1, swi3b-3 and bli-1, swi3b-3. D, Mature seed phenotypes of WT, swi3b-3, BLI-OE, and BLI-OE/swi3b-3 plants determined by microscopy. Bars = 1 mm. E, Seed size (length and width) of WT, swi3b-3, BLI-OE, and BLI-OE/swi3b-3. F, Seed mass of WT, swi3b-3, BLI-OE, and BLI-OE/swi3b-3. G, Mature seed phenotypes of WT, bli-1, clf-28, and bli-1 clf-28 plants determined by microscopy. Bars = 1 mm. H, Seed size (length and width) of WT, bli-1, clf-28, and bli-1 clf-28. I, Seed mass of WT, bli-1, clf-28, and bli-1 clf-28. J, Mature seed phenotypes of WT, BLI-OE, CLF-OE, and BLI-OE/CLF-OE plants determined by microscopy. Bars = 1 mm. K, Seed size (length and width) of WT, BLI-OE, CLF-OE, and BLI-OE/CLF-OE. L, Seed mass of WT, BLI-OE, CLF-OE, and BLI-OE/CLF-OE. For seed size measurements, values are means ± sd (N = 3); each of the three assays for each biological replicate contained 50 seeds. For seed mass, data shown are means ± sd (N = 3); each of the three assays for each biological replicate contained 100 seeds. Seed size or seed mass do not significantly differ when they are labeled with the same letter, as determined by Tukey’s HSD test (P < 0.05).

