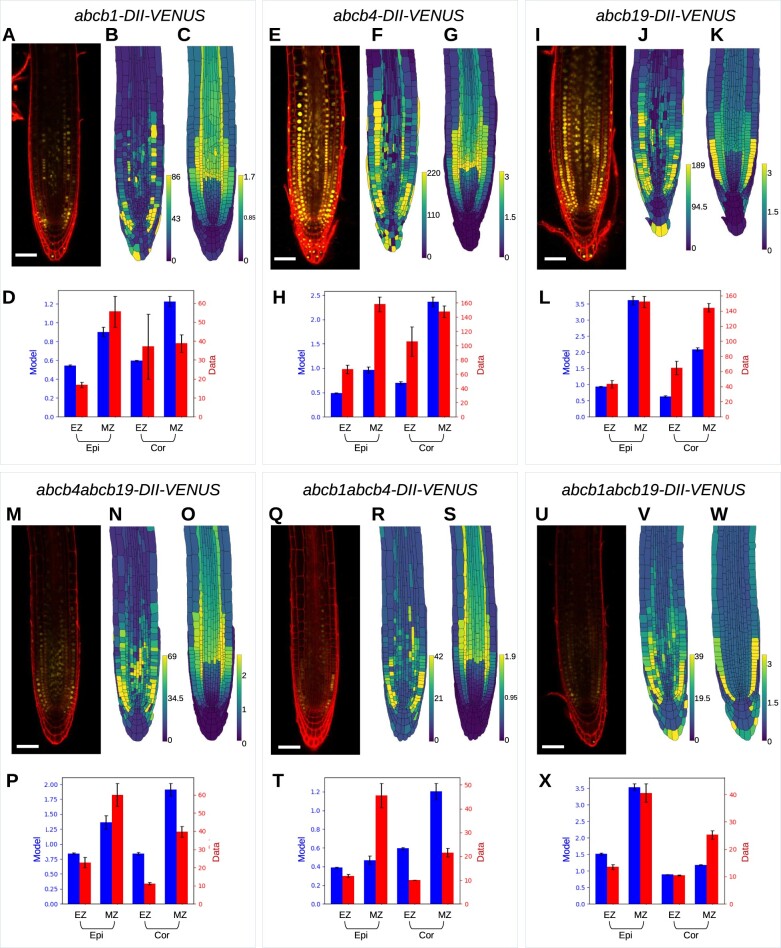
Figure 4.
Model predictions and experimental data for abcb single and double loss-of-function mutants. The model predictions use Scenario IV and integrate RT-qPCR data which quantifies the small upregulation of the remaining ABCBs in the mutant lines. (A–D) abcb1, (E–H) abcb4, (I–L) abcb19, (M–P) abcb4 abcb19, (Q–T) abcb1 abcb4, and (U–X) abcb1 abcb19. A, E, I, M, Q, and U, Confocal images showing DII-VENUS (yellow) with propidium iodide background staining (red). B, G, J, N, R, and V, Measured DII-VENUS levels extracted from the corresponding confocal image. C, G, K, O, S, and W, Predicted DII-VENUS distributions. D, H, L, P, T, and X, Mean DII-VENUS in the meristematic and EZ regions of the epidermis and cortex, comparing the model predictions and experimental data. Error bars show ±1 SE (standard error). We note that to aid readability, the data presented in Figure 3, S and T are repeated here in Figure 4, U and V.

