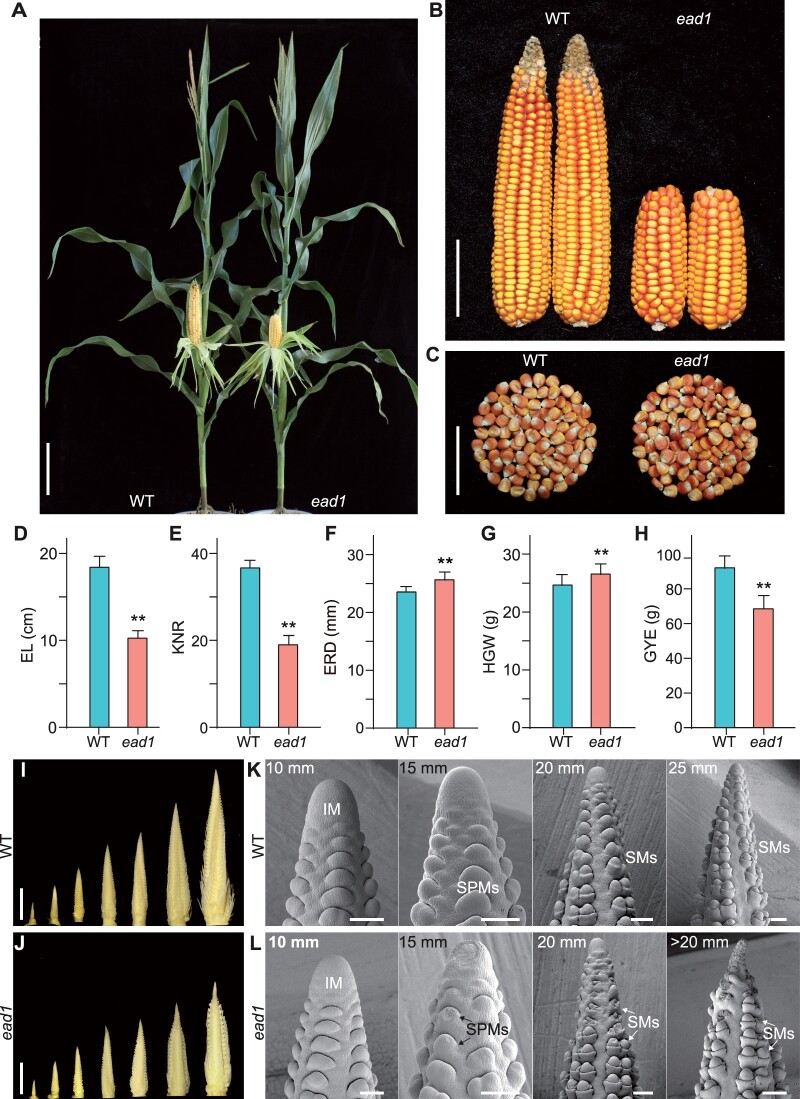
Figure 1.
Phenotypic comparisons of WT and ead1. A–C, Corn plants at the milk-ripe stage (A), ears (B), and kernels (C) at the full-ripe stage. WT HN321, WT. Scale bar = 20 cm in (A), 5 cm in (B) and (C). D–H, Comparison of ear traits between WT and ead1.Values are means, error bars represent standard deviation (sd) (n = 15). **P < 0.01 as determined by two-tailed Student’s t test between WT and ead1. I and J, Developing immature ears at 5, 10, 15, 20, 25, 30, and 40 mm in length in WT (I) and at 5, 10, 15, 20, and >20 mm length in ead1 (J). Scale bars = 10 mm. K and L, SEM analysis of the apical parts of immature ears in WT (K) and ead1 (L). Scale bars = 200 μm.

