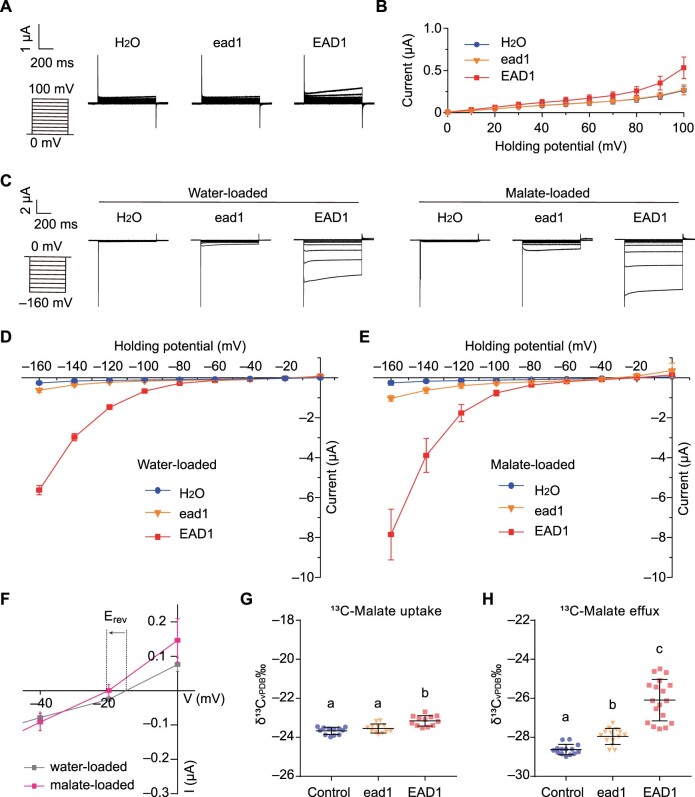
Figure 5.
Malate transport activity of EAD1. A and B, Outward current recordings in X. laevis oocytes injected with EAD1 or ead1 cRNA. A, Whole-cell currents recorded in oocytes injected with water control or with different cRNAs: EAD1, ead1. The outside solution contained malate at a final concentration of 20 mM. The holding potentials ranged from 0 to 100 mV (in 10-mV increments). The time and current scale bars for the recordings are shown. B, Mean I/V curves in oocytes constructed from steady-state currents recordings in (A). Values are means ± standard error (n = 10). C–E, Inward current recordings in X. laevis oocytes injected with EAD1 or ead1 cRNA. C, The oocytes were preloaded with either water (left) or malate (right). The holding potentials ranged from –160 to 20 mV (in 20-mV increments). The time and current scale bars for the recordings are shown. D and E, Mean I/V curves of the steady state currents in oocytes preloaded with water (D) or malate (E). F, Difference in the magnitude of EAD1-mediated current and shift in the holding potential (Erev) at which the current reverses sign between water-loaded and malate-loaded oocytes accumulating EAD1. G, Malate uptake activity of EAD1 cRNA- and ead1 cRNA-injected oocytes detected in a 10-mM 13C-labeled malate solution. Water-injected oocytes were used as negative control (n = 12). H, Malate efflux activity of EAD1- and ead1-accumulating oocytes. Oocytes preloaded with 36 nL of 100-mM 13C-labeled malate were incubated in the bath solution (ND96, pH 4.5) for 2 h. The total 13C amount of efflux was measured (n = 18). The scatterplots indicate the value of each sample and the black line indicates the means ± sd. Different letters in (G and H) indicate significant difference at P < 0.05 determined by Tukey’s HSD test.

