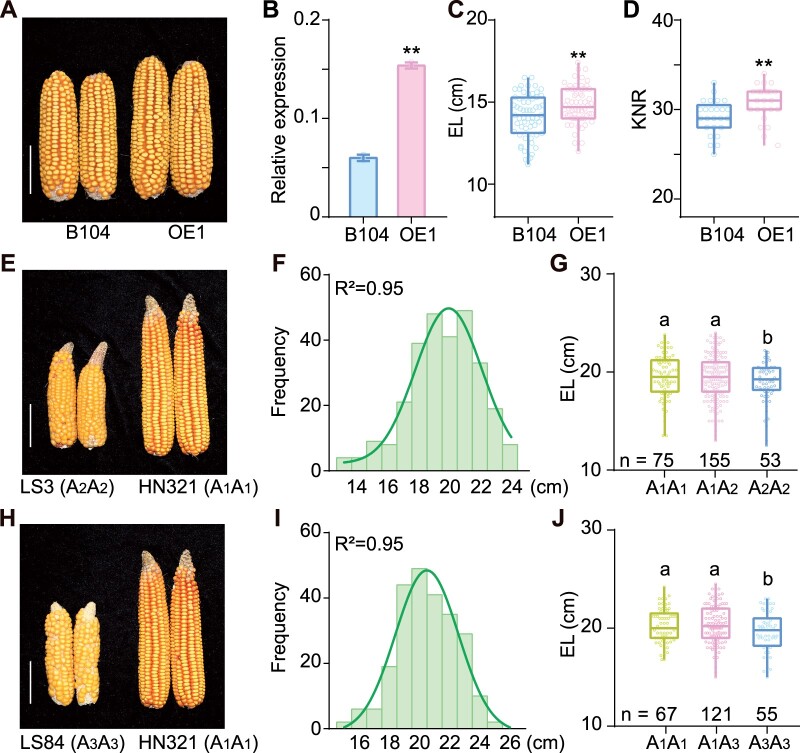
Figure 8.
Contribution of EAD1 to EL. A–D, EAD1-overexpression line (OE1) produces longer ears than a nontransgenic line (B104). A, Typical ears at the full-ripe stage. B, Relative EAD1 transcript levels, as analyzed by RT-qPCR. Values are means ± sd (n = 3). C and D, Average EL (C) (n = 60) and KNR (D) (n = 25) in OE1 line and B104. **P < 0.01 as determined by two-tailed Student’s t test. E–J, Effect of different EAD1 alleles on EL. E, Representative ears in two inbred lines with the A2A2 (LS3) or A1A1 (HN321) alleles of EAD1. F, Distribution of EL in the F2 segregating population derived from the HN321 × LS3 cross. G, Average EL of the A1A1 and A1A2 genotypes is significantly higher than that of the A2A2 genotype. H, Ears from two inbred lines with the A3A3 (LS84) or A1A1 (HN321) alleles of EAD1. I, Distribution of EL in the F2 segregating population derived from the HN321 × LS84 cross. J, Average EL of the A1A1 and A1A3 genotypes is significantly higher than that of the A3A3 genotype. Boxplots represent the range between first and third quartiles (25%–75%); whiskers, full data range; horizontal center line, median. Different letters in (G and J) indicate significant difference at P < 0.05 determined by Tukey’s HSD test. Scale bars = 5 cm in (A, E, and H).

