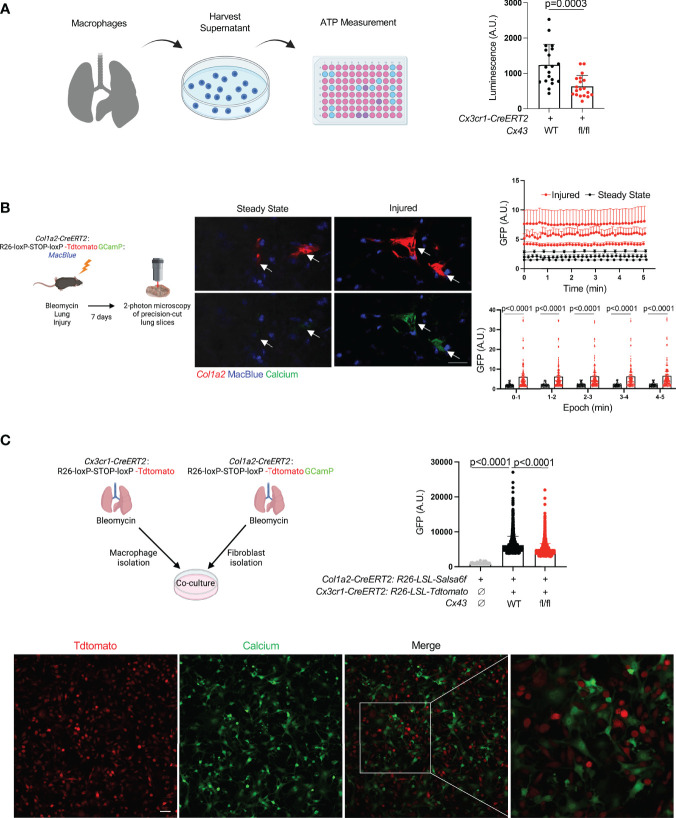
Figure 1.
Lung moMac Cx43 is required for ATP efflux and fibroblast cytosolic calcium in co-culture. (A) ATP measured in conditioned media after 24 hours of culture of tdTomato+ cells sorted from tamoxifen-induced Cx3cr1-CreERT2: LSL-tdTomato mice with or without homozygous floxed Cx43 alleles. Quantitation is for n=3 mice in each group, and points in the graph represent all technical replicates. P value is for Student’s unpaired two-tailed t-test. (B) Representative images of two-photon calcium imaging of precision-cut lung slices taken from Col1a2-CreERT2: R26-LSL-Salsa6f(tdtomato-GCaMP): MacBlue mice at steady state or 7 days after bleomycin injury. Arrows indicate fibroblasts. Scale bar= 50μm. Plots are for time-lapse imaging of individual slices from n=3 mice per condition (10-18 individual cells per field of view for injured and 5-11 individual cells per field of view for steady-state slices). Upper plot shows mean cytosolic GFP fluorescence for individual fibroblasts (as marked by tdTomato) for each slice across time; lower plot presents the same data as mean GFP fluorescence for aggregate data within 5 consecutive 1-minute time periods. P values are for 2-way ANOVA followed Sidak’s multiple comparison test. (C) Confocal calcium imaging of macrophages sorted from tamoxifen-induced Cx3cr1-CreERT2: R26-LSL-tdtomato mice and co-cultured with fibroblasts isolated from tamoxifen-induced Col1a2-CreERT2: R26-LSL-Salsa6f(tdtomato-GCaMP) mice. A representative field of view is shown, and the right-most image magnifies the indicated area in the merge. Scale bar= 50μm. Quantitation is for co-culture with WT or Cx43 KO macrophages, or for fibroblasts alone, for n=3 mice in each condition, and points in the graph represent individual cells. P values are for one-way ANOVA followed by Sidak’s multiple comparison test.

