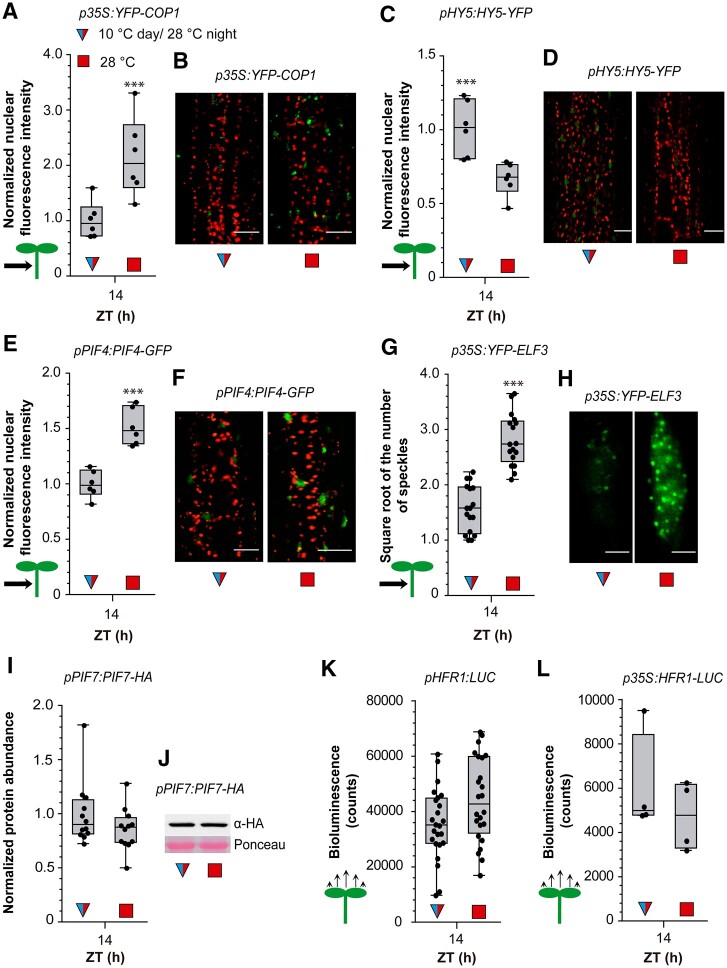
Figure 4.
Daytime temperatures affect nighttime signaling status. A and B, Nuclear fluorescence driven in hypocotyl cells by p35S:YFP-COP1. C and D, Nuclear fluorescence driven in hypocotyl cells by pHY5:HY5-YFP. E and F, Nuclear fluorescence driven in hypocotyl cells by pPIF4:PIF4-GFP. G and H, Number of ELF3 nuclear speckles (square root-transformed data) in the hypocotyl cells of the line expressing the p35S:YFP-ELF3 transgene. I and J, Abundance of PIF7 in seedlings bearing pPIF7:PIF7-HA. K and L, LUC activity driven by pHFR1:LUC (K) or p35S:HFR1-LUC (L). The seedlings received shade and either 10°C or 28°C during the day, EOD FR and 28°C during the night. Box plots show median, interquartile range 1–3 and the maximum–minimum interval of 6 (A, C, and E), 16 (G), 12 (I), 25 (K), and 4 (L) replicate boxes or plates with seedlings. Representative confocal (B, D, F, and H) and protein blot (J) images are shown. Scale bar = 35 µm (B, D, and F) and 2.61 µm (H). Asterisks indicate significant differences in t tests (***P < 0.001).

