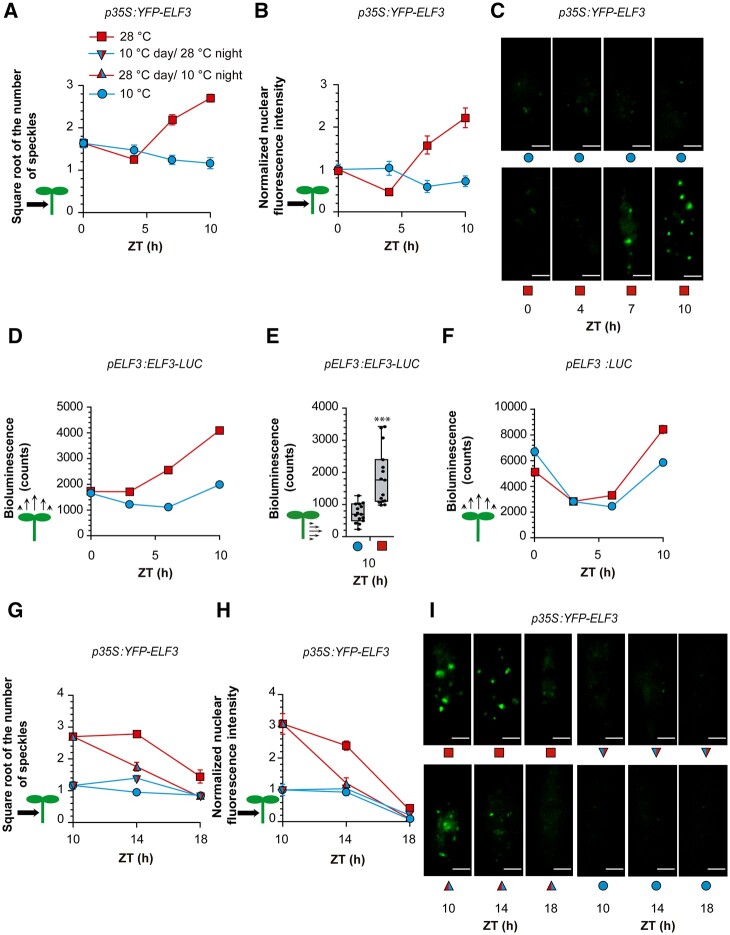
Figure 8.
ELF3 dynamics under contrasting temperatures. A–C, Number of ELF3 nuclear speckles (A), nuclear fluorescence intensity (B), and representative confocal images (C) from hypocotyl cells of seedlings expressing p35S:YFP-ELF3. D, LUC activity driven by pELF3:ELF3-LUC in whole seedlings. E, LUC activity driven by pELF3:ELF3-LUC in isolated hypocotyls. F, LUC activity driven by pELF3:LUC in whole seedlings. G–I, Number of ELF3 nuclear speckles (square root-transformed data, G), nuclear fluorescence intensity (H) and representative confocal images (I) from hypocotyl cells of seedlings expressing p35S:YFP-ELF3. All seedlings received shade during the day and EOD FR. See Supplemental Figure S4 for the kinetics of TOC1, LHY, and CCA1 promoter activities functionally linked to ELF3. (A and B and G and H) Data are means ± se of 20 replicate plates with seedlings. C and I, Representative confocal images. Scale bar = 2.61 µm. D and F, Data are means ± se of three plates with seedlings. E, Box plots show median, interquartile range 1–3 and the maximum–minimum interval of 15 replicate plates with seedlings. See Supplemental File S1, N–S for detailed statistics of (A and B, D, F–H). In (E), asterisks indicate significant differences in t test (***P < 0.001).

