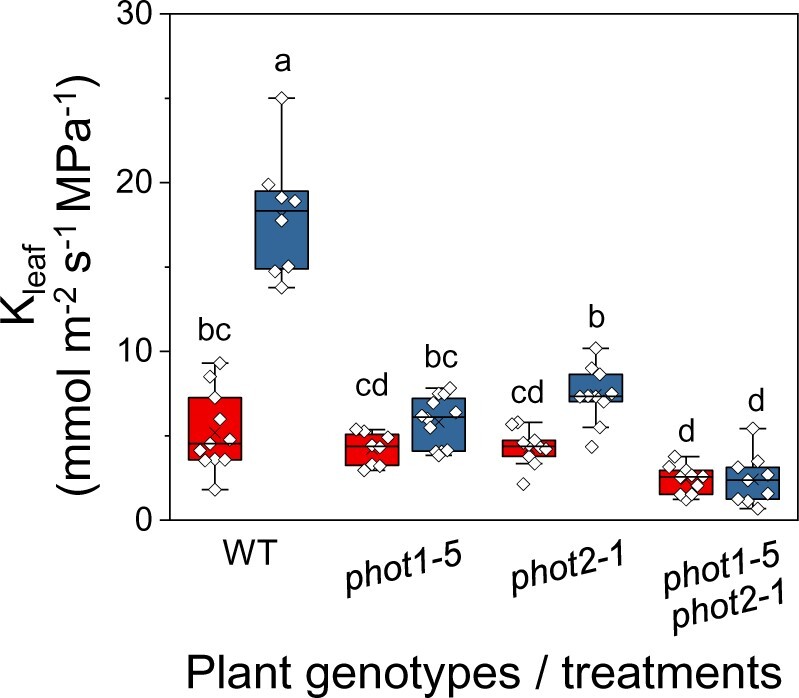
Figure 1.

The effect of BL on the Kleaf of PHOT receptor mutants. Kleaf of fully expanded, excised leaves of WT (Col-gl) and PHOT mutants [phot1-5 (Col-gl), phot2-1 (Col-gl), and a double mutant, phot1-5 phot2-1 (Col-gl)] determined immediately after 15 min of illumination with RL (left red boxes; 220 µmol m−2 s−1) or RL + BL (right blue boxes; 220 µmol m−2 s−1, consisting of 90% RL and 10% BL). The box height delimits 25%–75% of the data range. Symbols represent the individual data values, solid lines indicate the median, and × indicates the mean. The whiskers delimit ±1.5 times the inter-quartile range. Different letters indicate statistically different means (analysis of variance (ANOVA), Tukey’s honest significant difference (HSD) test, P < 0.05). Note the reduced response to RL + BL in the mutant lines.
