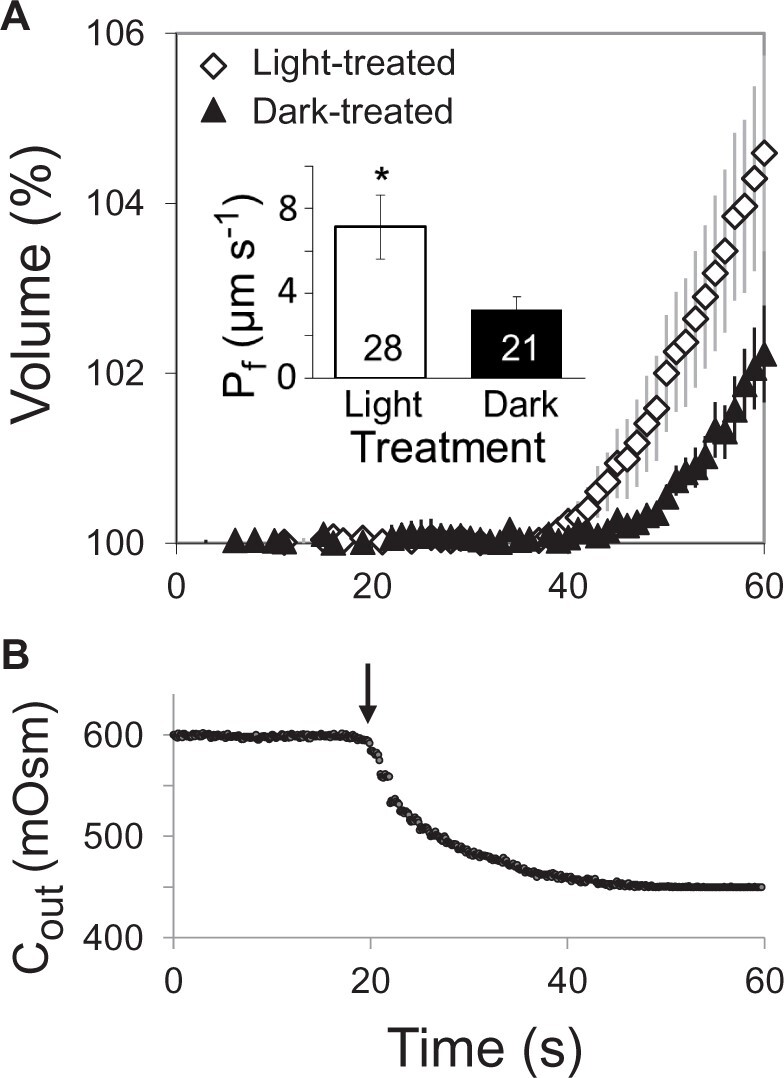
Figure 8.

WL increases the BSCs’ membrane osmotic water permeability coefficient (Pf). A, Time course of the swelling (mean relative volume ±se versus time) of n bundle-sheath protoplasts from SCR:GFP plants upon exposure to a hypotonic solution under the same illumination conditions (WL or darkness) as during the light treatment preceding the assay (“Materials and methods”). Inset: the mean (±se) initial Pf values of the indicated number (n) of BSC protoplasts under two illumination regimes from five independent experiments. The asterisk indicates a significant difference (at P < 0.05; Student’s two-tailed, nonpaired t test). B, Time course of the osmotic concentration change in the bath (Cout) during the hypotonic challenge; the arrow indicates the onset of the bath flush (“Materials and methods”).
