Figure 1.
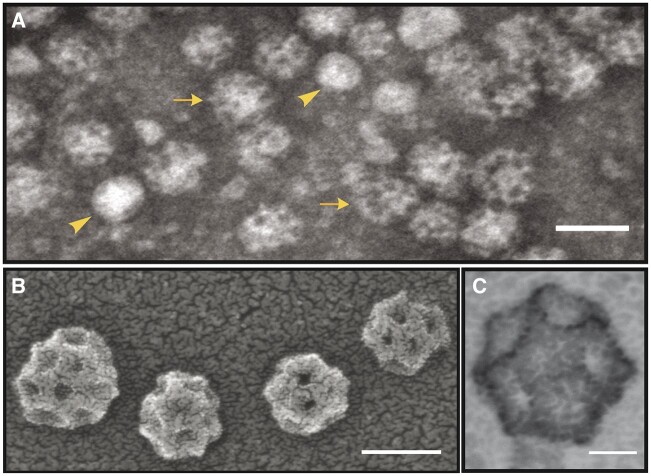
TEM of purified plant CCVs. A, Negative stain transmission electron micrographs of a typical CCV preparation. Uncoated vesicles are indicated by arrowheads and coated vesicles by arrows. B and C, Positive stain scanning transmission electron micrographs of CCVs. Scale bars (clockwise, starting top): 100, 20, and 50 nm.

