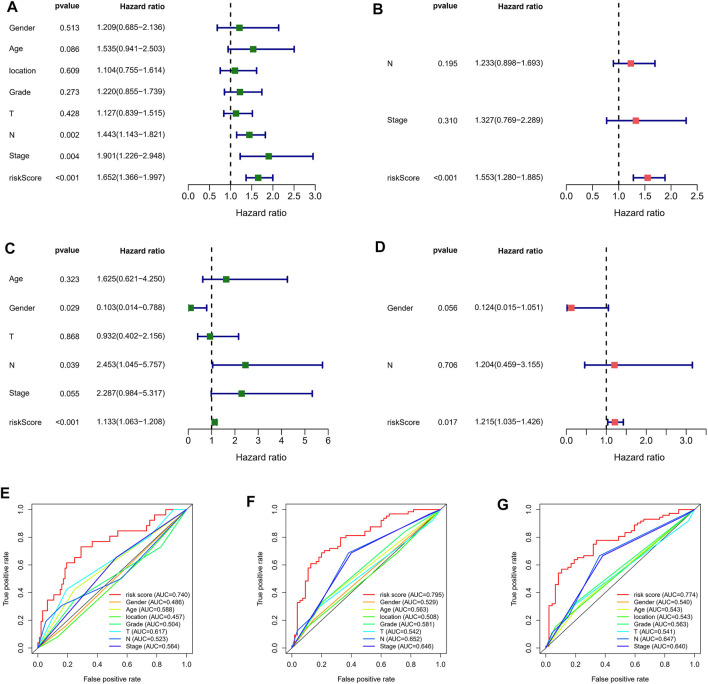
FIGURE 5.
Independent prognostic value of risk score. Univariate Cox regression analysis of the risk scores in GEO (A) and TCGA cohorts (B). Multivariate Cox regression analysis of the risk scores in GEO (C) and TCGA cohorts (D). ROC curves of 1- (E), 3- (F), and 5-years (G) OS predicted by the nomogram.

