FIGURE 6.
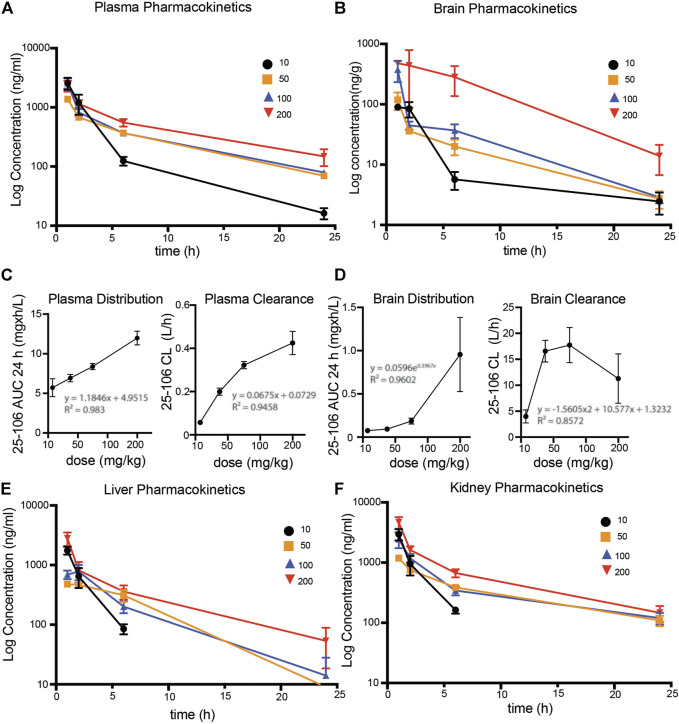
Pharmacokinetic profile of 25–106 (A,B). LC-MS/MS detected 25–106 used at four doses (10, 50, 100, and 200 mg/kg) across 1, 2, 6, and 24 h post injection in the plasma (A) and brain (B). (C) distribution and clearance of 25–106 in plasma. (D) Distribution and clearance of 25–106 in the brain. (E,F). LC-MS/MS detected a concentration of 25–106 in the liver (E) and kidney (F) (n = 4 for each treatment).

