Figure 1.
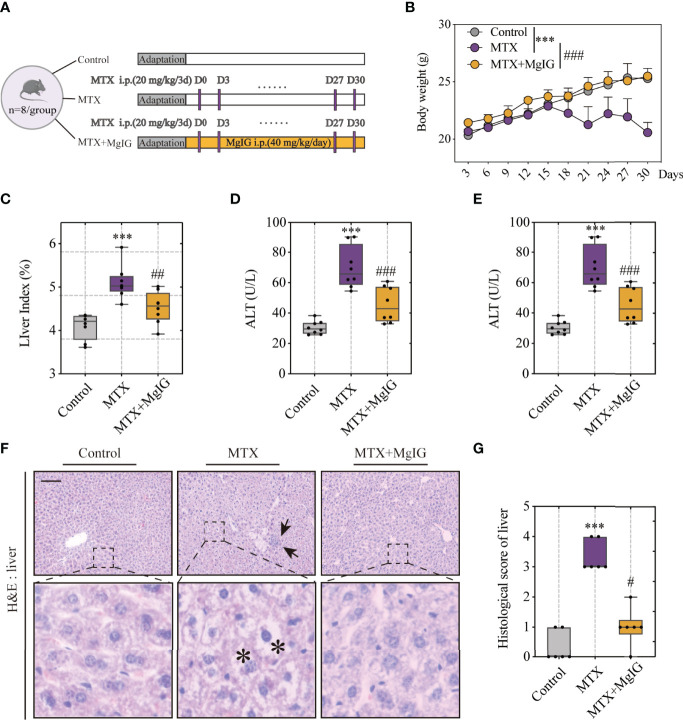
MgIG alleviated MTX-induced liver injury. (A) Experiment design. (B) Bodyweights during mouse model development (n = 8, Two-way ANOVA). (C) Liver index (liver weight/body weight) of each group (n = 8). (D, E) ALT and AST levels in serum(n = 8). (F) Representative H&E staining images of liver tissue from each group. Arrows and asterisks in the sections indicate histopathological differences between groups: inflammatory infiltration (arrow) and necrosis (asterisk). Scale bar, 100μm. (G) Histological score of liver tissue in each group (n = 6, Kruskal-Wallis test). ***p < 0.001, compared with Control group. #p < 0.05, ##p < 0.01, ###p < 0.001, compared with MTX group.

