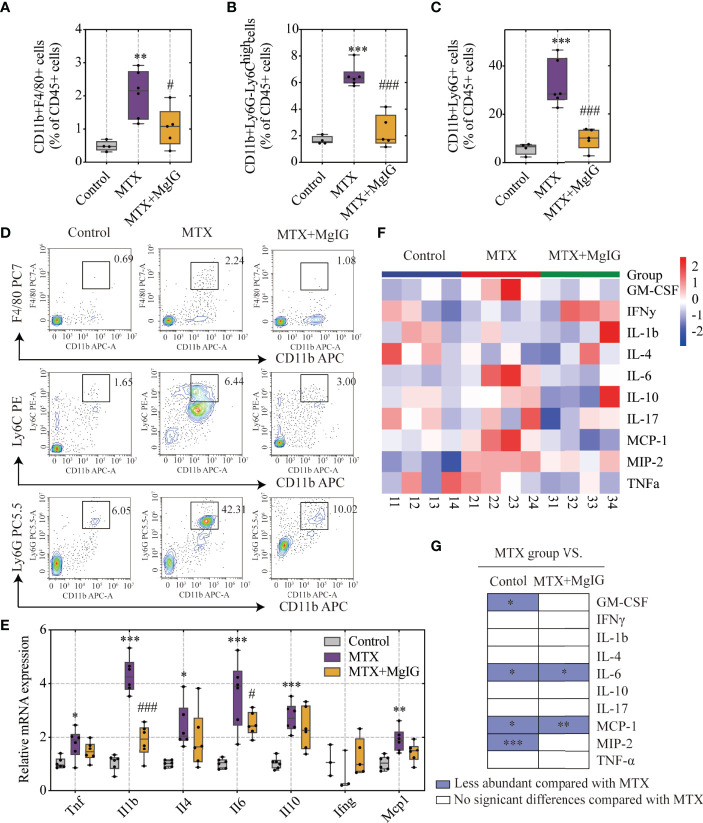
Figure 2.
MgIG reduced MTX-induced inflammation levels. (A–D) FACS staining of immune cells (neutrophils, monocytes and macrophages) in the liver represented as percentages of CD45+ cells (n = 4-6, One-way ANOVA). (E) Relative mRNA expression of cytokines in liver tissues from each group (n = 3-6). (F) Heatmap of specific cytokine and chemokine levels in serum, including IFN-γ, IL-4, IL-6, GM-CSF, IL-1β, IL-17, IL-10, TNF-α, MIP-2, MCP-1 (n = 4). (G) Cytokines and chemokines from panel F and comparisons of MTX and other groups. Purple entries indicate cytokines/chemokines that were less abundant in various groups compared to the MTX group. *p < 0.05, **p < 0.01, ***p < 0.001, compared with Control group. #p < 0.05, ###p < 0.001, compared with MTX group. ALT, alanine aminotransferase; AST, aspartate aminotransferase.

