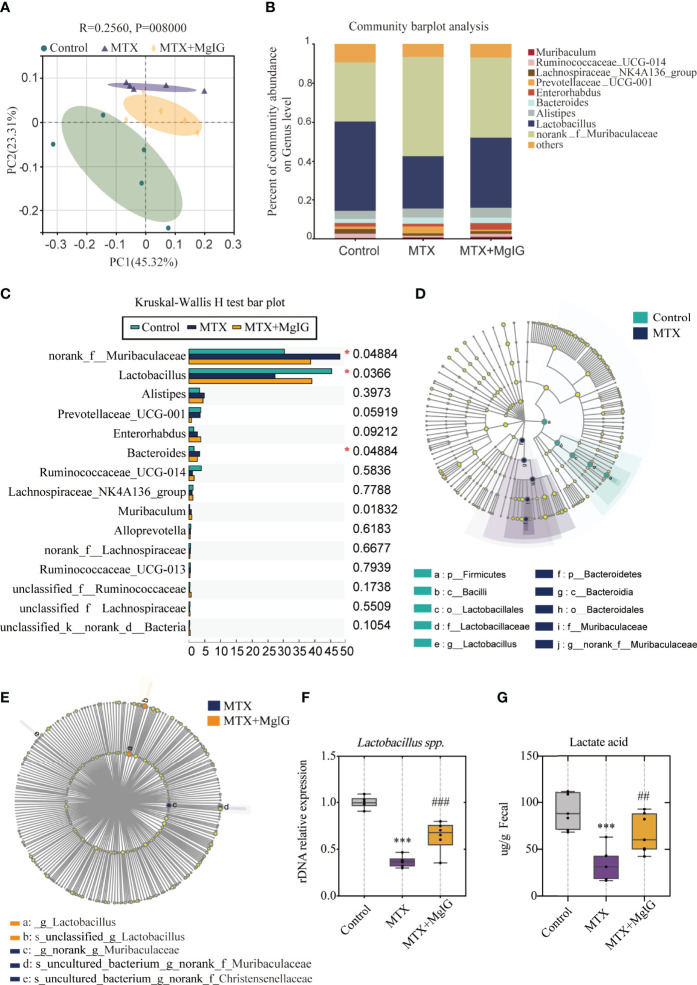
Figure 6.
16s rDNA sequencing revealed altered microbiota composition after MTX or MgIG treatment (A) PCoA analysis with the ANOSIM significant test for each group (n = 5). (B) Relative abundance of microbial taxa was determined at the genus level. Top 10 abundances are shown. (C) Significance test of multiple groups using Kruskal-Wallis H test. (D, E) Multilevel species-level bar chart from LEfSe analysis, showing biomarker taxa at the genus level (LDA score) of >4 and a significance of P < 0.05 determined by the Wilcoxon signed-rank test. (F) 16s rDNA relative expression measured by quantitative PCR. (G) Fecal lactic acid concentration of each group (n = 6). ***p < 0.001, compared with Control group. ##p < 0.01, ###p < 0.001, compared with MTX group.

