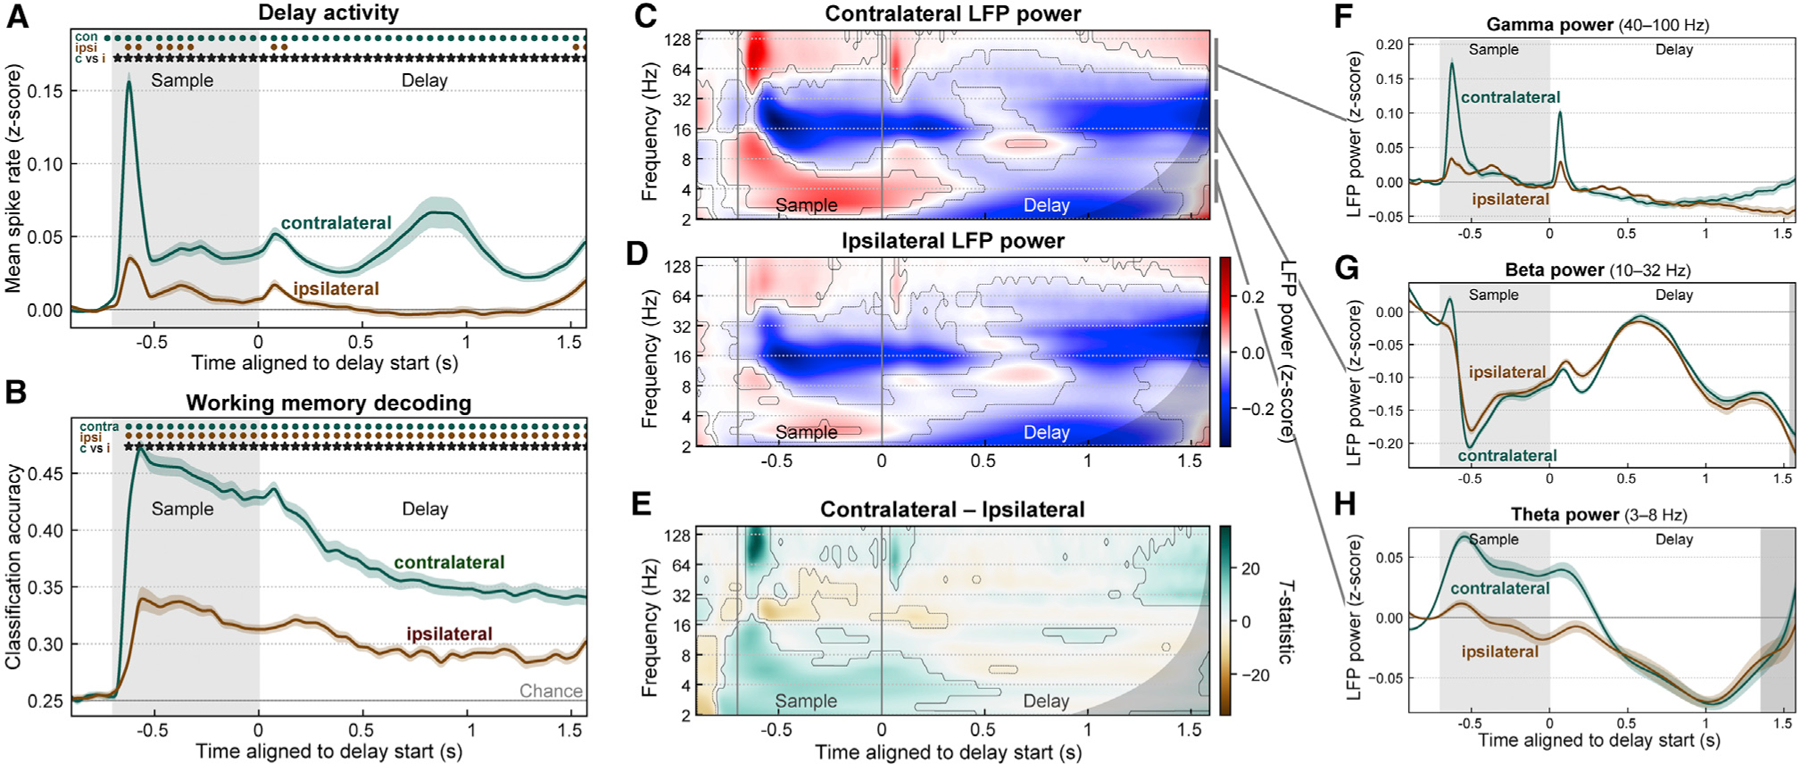
Figure 2. Contralateral bias in prefrontal cortex.

(A) Population mean spike rates (multi-unit activity Z-scored to baseline, ± SEM across 56 sessions) for sample objects contralateral (green) and ipsilateral (brown) to the recorded prefrontal hemisphere (pooled across left and right). Activity for contralateral samples was greater than baseline (green dots) and greater than activity for ipsilateral samples (stars). See also Figure S1.
(B) Mean (± SEM) accuracy for decoding the item held in WM (object identity and upper/lower location) from prefrontal population spike rates, for samples in the contralateral (green) and ipsilateral (brown) visual hemifield. Contralateral decoding accuracy was greater than ipsilateral (stars).
(C and D) Mean time-frequency LFP power (Z-scored to baseline) for contralateral (C) and ipsilateral (D) samples. Contours indicate significant change from baseline. Gray regions to right of (C)–(H) indicate time points with possible temporal smearing of test-period effects. Gamma (~40–100 Hz) and theta (~3–8 Hz) power increased from baseline (red), while beta (~10–32 Hz) power was suppressed from baseline (blue).
(E) Contrast (paired-observation t-statistic map) between contralateral and ipsilateral power. Contours indicate significant difference.
(F–H) Summary of LFP power for contralateral (green) and ipsilateral (brown) sample objects, pooled within frequency bands: gamma (F), beta (G), and theta (H). Because of off-axis structure in the time-frequency data, these one-dimensional (1D) plots cannot fully capture it and are thus included only to aid visualization. All modulations from baseline were stronger for contralateral samples, but only gamma showed a difference during the delay period.
See also Figure S2.
