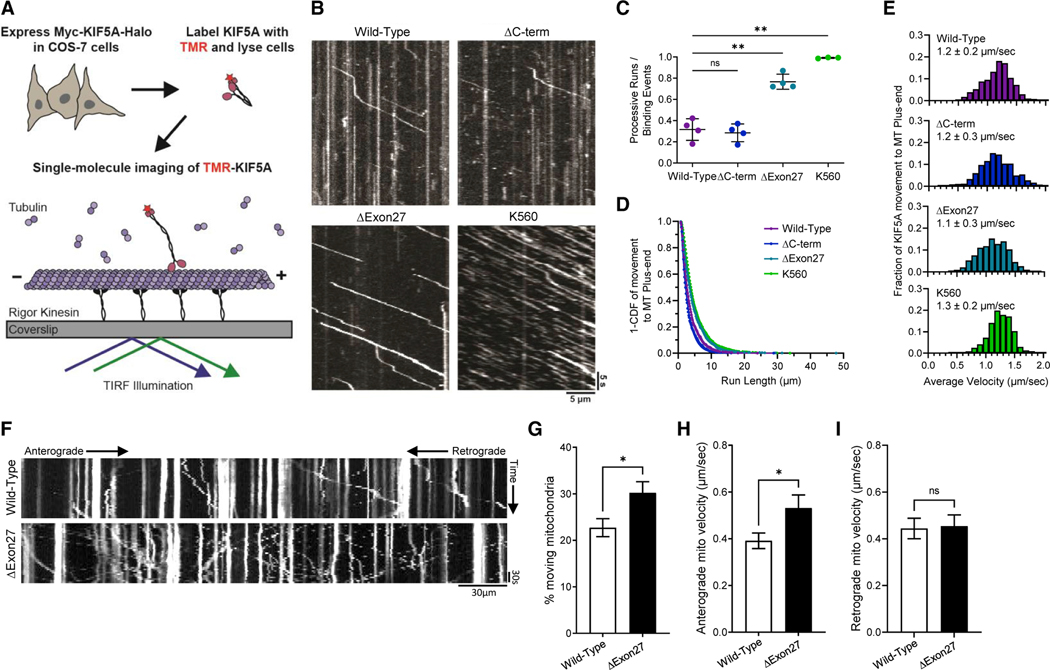
Figure 3. Mutant KIF5A displays qualities of a hyperactive kinesin in axonal transport.
(A) Schematic representation of the single-molecule labeling method used to track KIF5A axonal movement.
(B) Representative kymograms showing the effect of KIF5AΔC−Term, KIF5AΔExon27, and KIF5AK560 mutations on motility compared with KIF5AWT. Scale bars, 5 μm (distance) and 5 s (time).
(C) Quantification of the ratio of processive runs to total binding events for KIF5A. n = 3–4 biological replicates with p = 0.0022 for K560 versus wild-type, p = 0.0021 for ΔExon27 versus wild-type and non-significant for ΔC-term versus wild-type as determined by the Brown-Forsythe ANOVA with Dunnett’s multiple comparison test.
(D and E) Inverse cumulative distribution functions (CDF) of run length and histogram distributions of velocity for KIF5A transport to the MT plus end (n = 652 events for wild-type, 667 events for ΔC-term, 1,074 events for ΔExon27, and 660 events for K560 samples). The curves in CDF graph (D) represent single exponential decay fits. The values in (C and E) are mean ± SD.
(F) Representative kymograms showing the effect of the KIF5AΔExon27 on mitochondrial transport. Scale bar, 30 mm (distance) and 30 s (time).
(G–I) Quantification of mitochondrial transport characteristics. The total number of moving mitochondria (G) are reported as well as anterograde mitochondrial velocity (H), and retrograde velocity (I). For each experiment n = 3 biological replicates p = 0.017 in (G), 0.032 in (H), and is non-significant (ns) in (I). The data represented in (G–I) are mean ± SEM.

