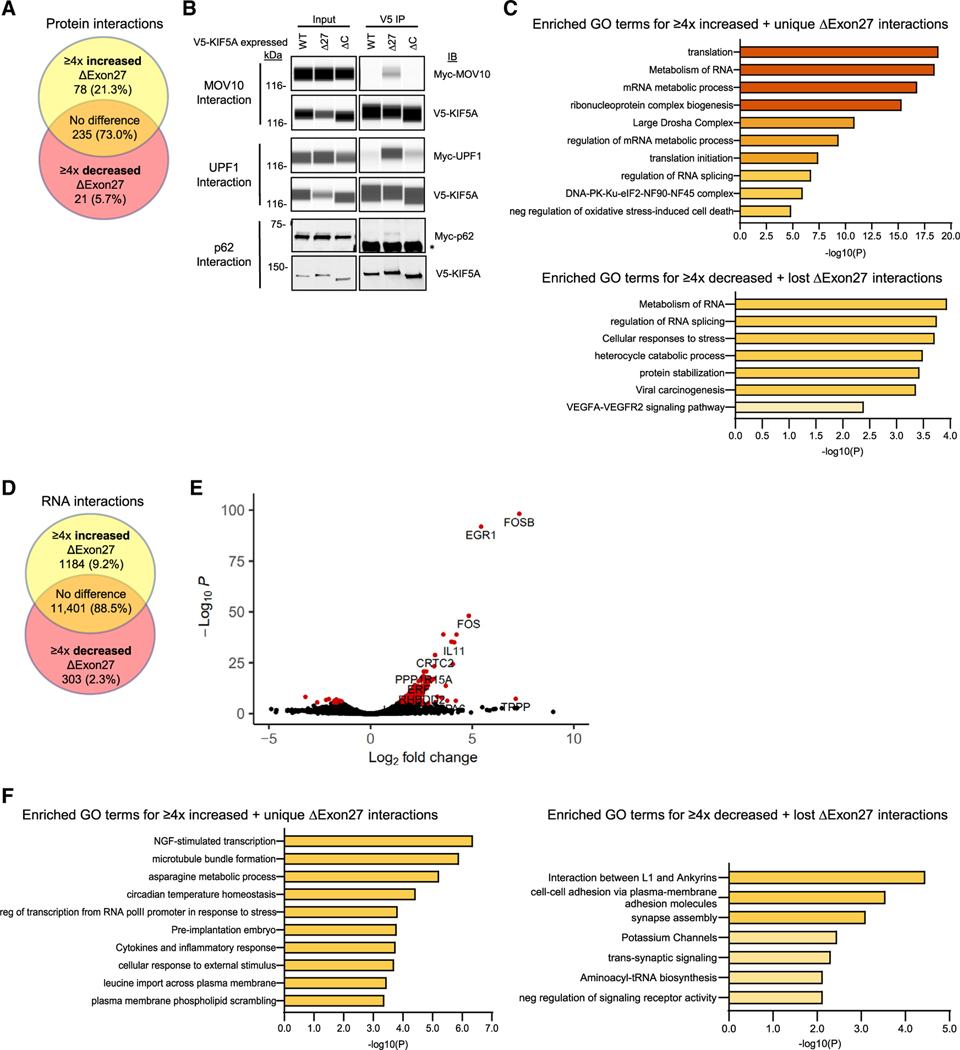
Figure 4. KIF5A binding partners are altered in cells expressing mutant KIF5A.
(A) Mass spectrometry analysis of V5-tagged KIF5AWT and KIF5AΔExon27 bound proteins in SKNAS cells. Venn diagram indicates the number of protein binding partners altered in KIF5AΔExon27 mutant immunoprecipitations. Yellow region: proteins that are unique to, or have ≥4× increase in the amount bound to, KIF5AΔExon27. Red region: proteins that are absent from, or have ≥4× decrease in the amount bound to, KIF5AΔExon27. Orange region: proteins that show no binding preference to either form of KIF5A.
(B) Validation of several Myc-tagged mass spectrometry hits from (A) by western blotting. Capillary western blots of MOV10 (upper panel) and UPF-1 (middle panel) show the strong interaction of V5-KIF5AΔExon27, but not KIF5AWT. Exposure settings for the capillary western blots were adjusted individually for each band of interest as needed for each sample set (samples of the same type; ex:. all of the input samples). A traditional western blot of p62 (lower panel) also shows a unique interaction with V5-KIF5AΔExon27. Asterisk: the antibody heavy chain pulled down in the IP. The blot for MOV10, UPF1, and p62 is representative of n = 4, n = 1, and n = 4 biological replicates, respectively.
(C) Pathway analysis on the proteins enriched (upper) and diminished (lower) in the KIF5AΔExon27 mutant mass spectrometry sample
(D) Analysis of RNAs associated with immunoprecipitated V5-tagged KIF5AWT and KIF5AΔExon27 mutant containing complexes. The Venn diagram indicates how many RNAs had altered interactions with KIF5AΔExon27 mutant samples as described in (A).
(E) A volcano plot of RNA immunoprecipitation results sowing significantly altered RNA interactors in red. Data are based on n = 2 biological replicates.
(F) Pathway analysis on the RNAs enriched (left) and diminished (right) in the KIF5AΔExon27 mutant sample. See expanded pathway analyses in Figure S2.

