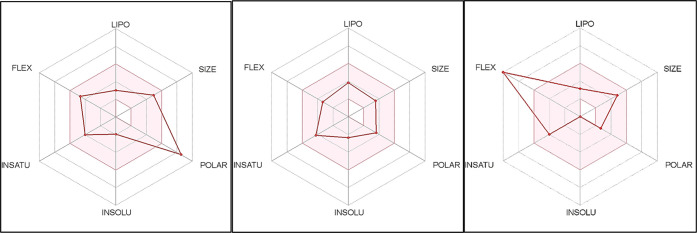
Figure 10.
Bioavailability radar chart of the phytoleading compounds (glucotropaeolin, 1-pentyltetrahydro-β-5,6-carboline-3-carboxylic acid, and N-(3-methoxybenzyl)-(9Z,12Z,15Z)-octadecatrienamide, respectively). The pink area represents the range of the optimal property values for oral bioavailability, and the red line is the compound’s predicted properties. Saturation (INSATU), size (SIZE), polarity (POLAR), solubility (INSOLU), lipophilicity (LIPO), and flexibility (FLEX).

