
Figure 8.
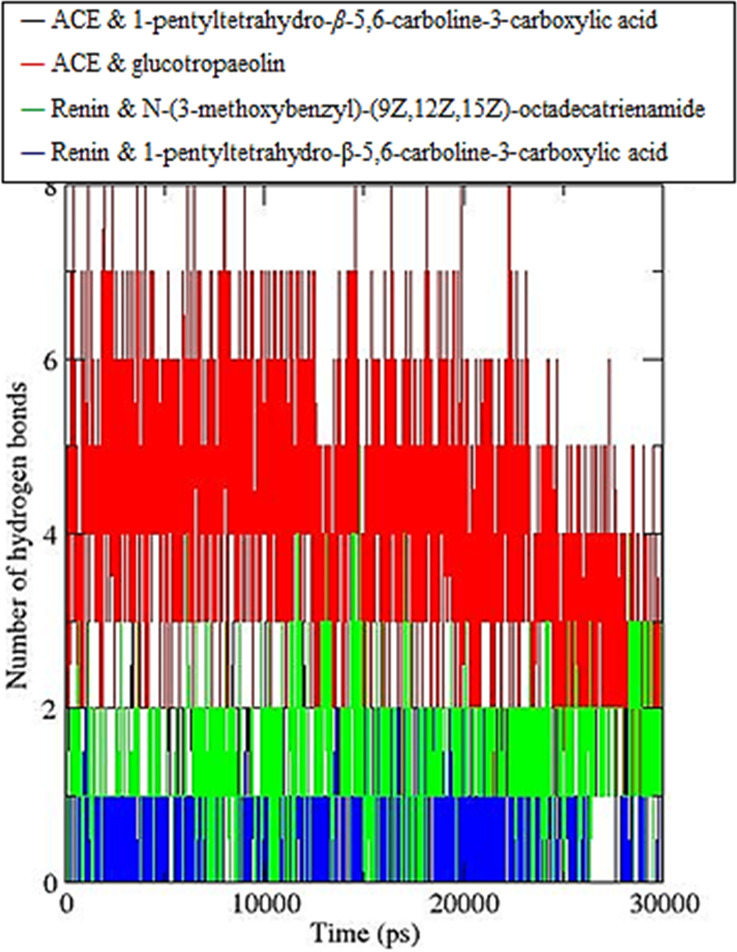
Number of hydrogen bonds calculated over 30 ns molecular dynamics, where the ACE and 1-pentyltetrahydro-β-5,6-carboline-3-carboxylic acid simulation is shown in black, the ACE and glucotropaeolin simulation is shown in red, the renin enzyme and N-(3-methoxybenzyl)-(9Z,12Z,15Z)-octadecatrienamide simulation is shown in green, and the renin enzyme 1-pentyltetrahydro-β-5,6-carboline-3-carboxylic acid simulation is shown in blue.