Figure 5.

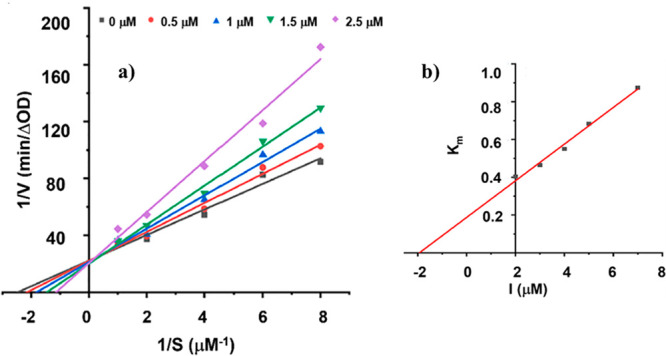
(a) Lineweaver–Burk plot for compound 2n. (b) Secondary replot of slopes (Lineweaver–Burk plot) vs various concentrations of compound 2n.

(a) Lineweaver–Burk plot for compound 2n. (b) Secondary replot of slopes (Lineweaver–Burk plot) vs various concentrations of compound 2n.