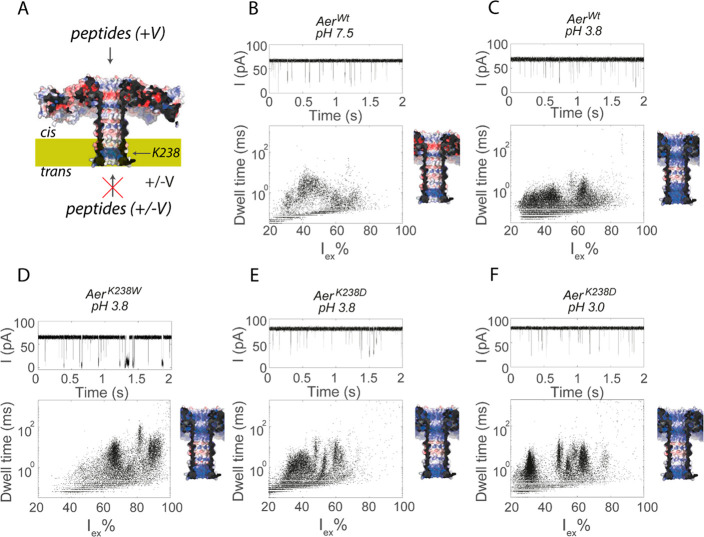
Figure 1.
Detection of trypsinated lysozyme by aerolysin. (A) Cut-through structure of the aerolysin nanopore (PDB 5JZT) shown as surface potential maps with positively or negatively charged regions in blue and red, respectively. (B–F) Ionic current traces (top) and dwell time vs excluded current (bottom left) for aerolysin nanopores under different pH values. The figures on the right indicate the potential map of the charge distribution inside the nanopore at different pH values. Peptides were tested by adding 4 μg of trypsinated lysozyme to the cis compartment (400 μL). The final concentration of trypsinated lysozyme was 10 ng/μL. Data were recorded in 1 M KCl at an applied potential of +150 mV at the indicated pH.

