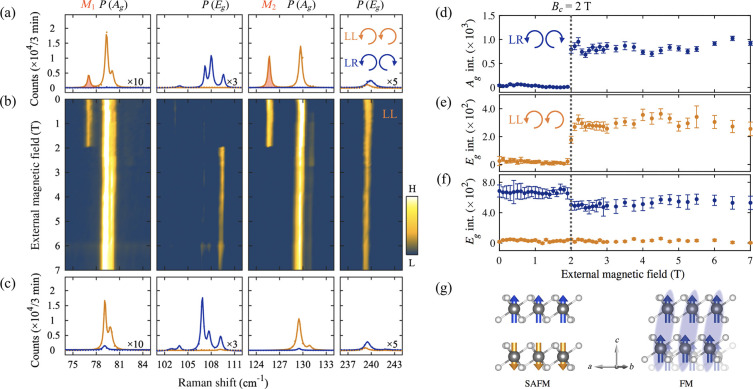
Figure 15.
(a) Raman spectra taken on bulk CrI3 in LL and LR channels at 10 K and 0 T. P(Ag), P(Eg), and M1,2 label phonon modes of Ag, Eg symmetry and coupled with layered magnetism, respectively. (b) Color map of magnetic field dependent Raman spectra taken in the LL channel. (c) Raman spectra taken on bulk CrI3 in LL and LR channels at 7 T. (d–f) Magnetic field dependence of selected Ag and Eg phonon modes. (g) A schematic illustration of the monoclinic distortion across the layered surface AF to FM transition. Adapted with permission under a Creative Commons CC BY 4.0 license from ref (218). Copyright 2020 American Physical Society.

