
Figure 19.
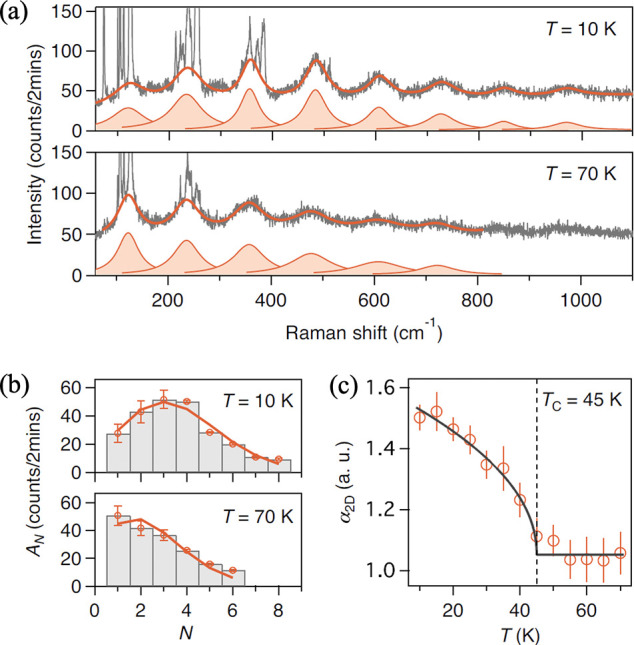
(a) Raman
spectra of 2L CrI3 taken at 10 and 70 K with
an excitation wavelength of 633 nm. Solid orange lines are fits to
the raw Raman spectra, using a sum of N Lorentzian
profiles and a constant background,  . (b) Histogram plot of
the fitted Lorentzian
mode intensity (AN) as
a function of N at 10 and 70 K. Solid curves are
fits of the peak intensity profiles to the Poisson distribution functions,
. (b) Histogram plot of
the fitted Lorentzian
mode intensity (AN) as
a function of N at 10 and 70 K. Solid curves are
fits of the peak intensity profiles to the Poisson distribution functions,  . (c)
Plot of 2D e-ph coupling constant
(α2D) as a function of temperature.
The dashed vertical line marks the magnetic onset TC = 45 K. Adapted with permission under
a Creative Commons CC BY license from ref (220). Copyright 2020 Springer Nature.
. (c)
Plot of 2D e-ph coupling constant
(α2D) as a function of temperature.
The dashed vertical line marks the magnetic onset TC = 45 K. Adapted with permission under
a Creative Commons CC BY license from ref (220). Copyright 2020 Springer Nature.