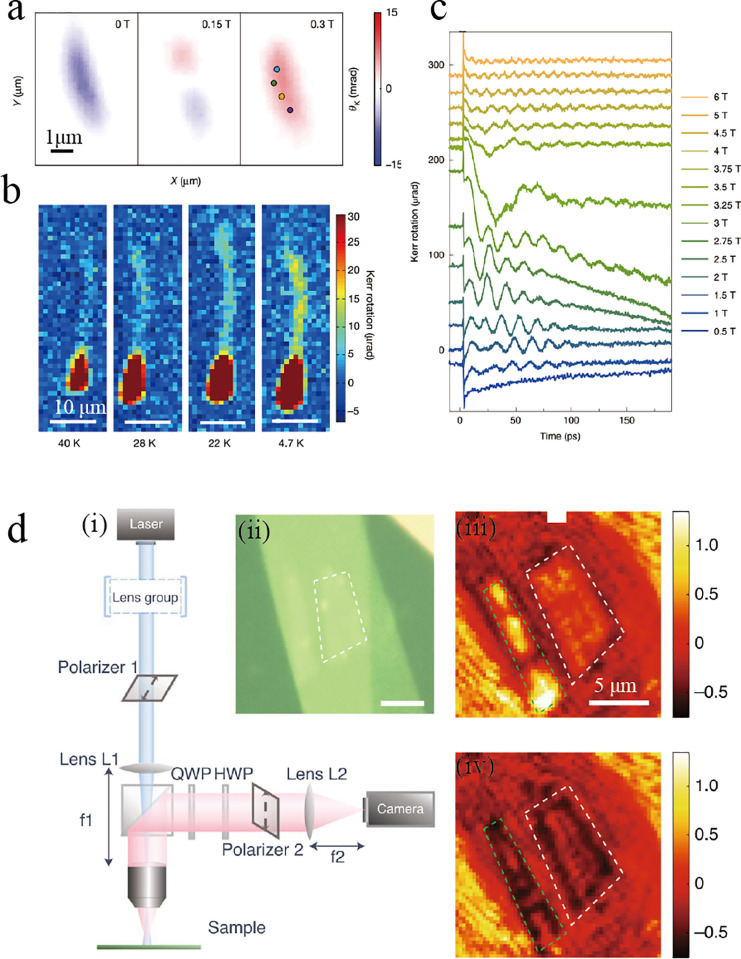
Figure 23.
(a) MOKE maps of a CrI3 monolayer at external magnetic fields of 0, 0.15, and 0.3 T. Adapted with permission from ref (5). Copyright 2017 Springer Nature. (b) Kerr rotation signal for Cr2Ge2Te6 bilayer flake under 0.075 T as the temperature decreases from 40 to 4.7 K. The average background signal has been subtracted and the signals are truncated at 30 μrad. Adapted with permission from ref (6). Copyright 2017 Springer Nature. (c) Pump-induced Kerr rotation as a function of pump–probe delay time in bilayer CrI3 under different in-plane magnetic fields. Adapted with permission from ref (28). Copyright 2020 Springer Nature. (d) (iii) Illustration of the wide-field MCD experimental setup. Blue and red beams represent illumination light from the laser and scattered light from the sample with different effective numeric apertures. HWP: Half-wave plate. QWP: Quarter-wave plate. (ii–iv) Optical microscopy image (ii) and polarization-enhanced MCD image (iii, iv) of a monolayer CrBr3 (white dashed box). The MCD image shows giant optical contrast of ±60% for the positive (iii) and negative (iv) remnant magnetization. Adapted with permission from ref (246). Copyright 2020 Springer Nature.

