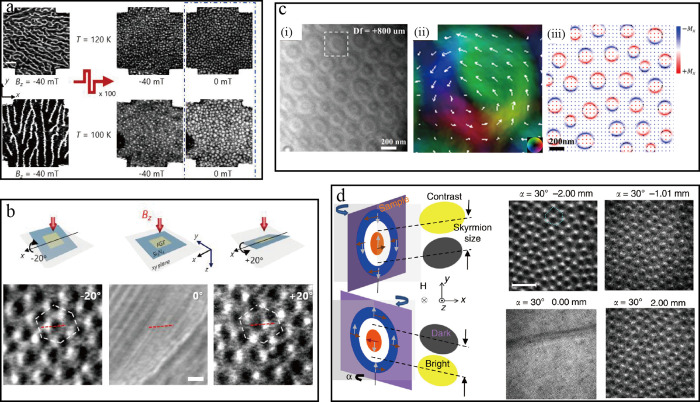
Figure 24.
(a) STXM images show the initial labyrinth domain states stabilized at 120 and 100 K transformed to the magnetic skyrmion lattices induced by bipolar pulse bursts. The other two images at Bz = 0 mT were acquired after removing the external fields. (b) Lorentz TEM images of magnetic skyrmion lattices taken at the sample tilting angle of −20° (left), 0° (middle) and 20° (right) with respect to x-axis as illustrated in the upper panels at Bz = −40 mT and 160 K, respectively. Panels (a) and (b) are adapted with permission from ref (26). Copyright 2021 American Physical Society. (c) (i) Overfocused Lorentz-TEM images of the skyrmion bubbles taken at 93 K and in zero-field. (ii) An enlarged in-plane magnetization distribution map obtained by transport of intensity equation analysis for a selected skyrmion bubble indicated by the white dotted box in (i). (iii) Simulation of skyrmion lattices at an out-of-plane field of 60 mT. Adapted with permission from ref (25). Copyright 2020 American Chemical Society. (d) Schematic diagram of a Néel-type skyrmion on a tilt sample for Lorentz TEM imaging (left). The orange and blue circles are for positive and negative magnetizations along z direction, respectively. Brown arrows indicate the in-plane magnetization component, while gray arrows indicate the Lorentz force. Lorentz TEM images (right) observation of skyrmion lattice from under focus to over focus on WTe2/40L Fe3GeTe2 samples at 180 K with a field of 51 mT. Adapted with permission under a Creative Commons CC BY license from ref (27). Copyright 2020 Springer Nature.

