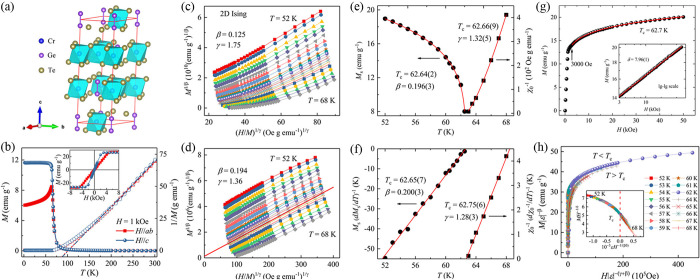
Figure 26.
(a) Crystal
structure of Cr2Ge2Te6. (b) Temperature
dependence of magnetization for Cr2Ge2Te6 measured in H = 1 kOe. Inset:
Field dependence of magnetization at T = 2 K. (c)
2D Ising model plot of isotherms around Tc. (d) Modified Arrott plot of M1/βversus (H/M)1/γ with β = 0.194 and γ
= 1.36. The straight line is the linear fit of isotherm at T = 62.5 K. (e) Temperature dependence of the spontaneous
magnetization Ms (left)
and the inverse initial susceptibility  (right) with solid fitting curves.
(f)
Kouvel–Fisher plots of
  (left) and
  (right) with solid fitting curves. (g)
Isotherm MversusH plot collected at Tc = 62.7 K. Inset: The same plot in log–log scale with a solid
fitting curve. (h) Scaling plots of renormalized magnetization mversus renormalized field h below and above Tc for
Cr2Ge2Te6. Inset: The rescaling of
the M(H) curves by MH–1/δversus εH–1/(βδ).
All panels adapted with permission from ref (279). Copyright 2017 American
Physical Society.

