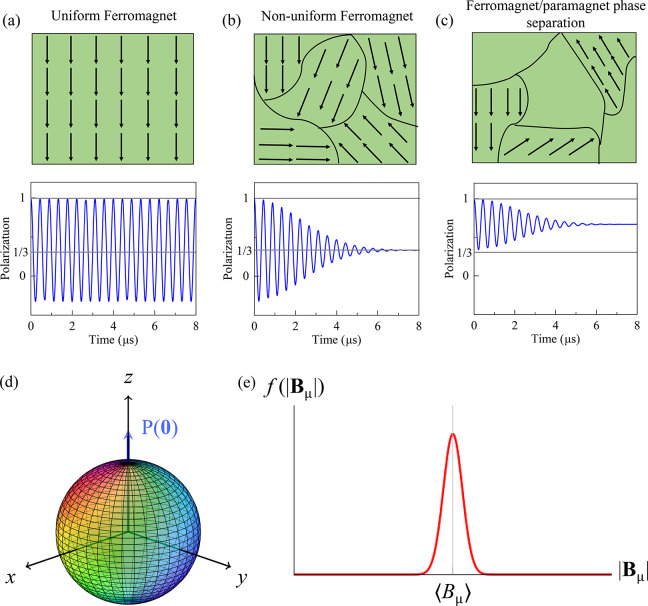
Figure 32.
(a-c) Schematic illustration of the magnetically homogeneous (i.e., full volume magnetic) (d), inhomogeneous (full volume magnetic, but with domains) and phase separated (i.e., part of the volume magnetic and part paramagnetic) polycrystalline samples and the corresponding μSR spectra. The 1/3 nonoscillating μSR signal fraction originates from the spatial averaging in powder samples where 1/3 of the magnetic field components are parallel to the muon spin and do not cause muon spin precession. (d, e) Isotropic Gaussian field distribution for polycrystalline sample. Panels (a–c) adapted with permission under a Creative Common CC BY license from ref (350). Copyright 2019 MDPI.

