
Figure 34.
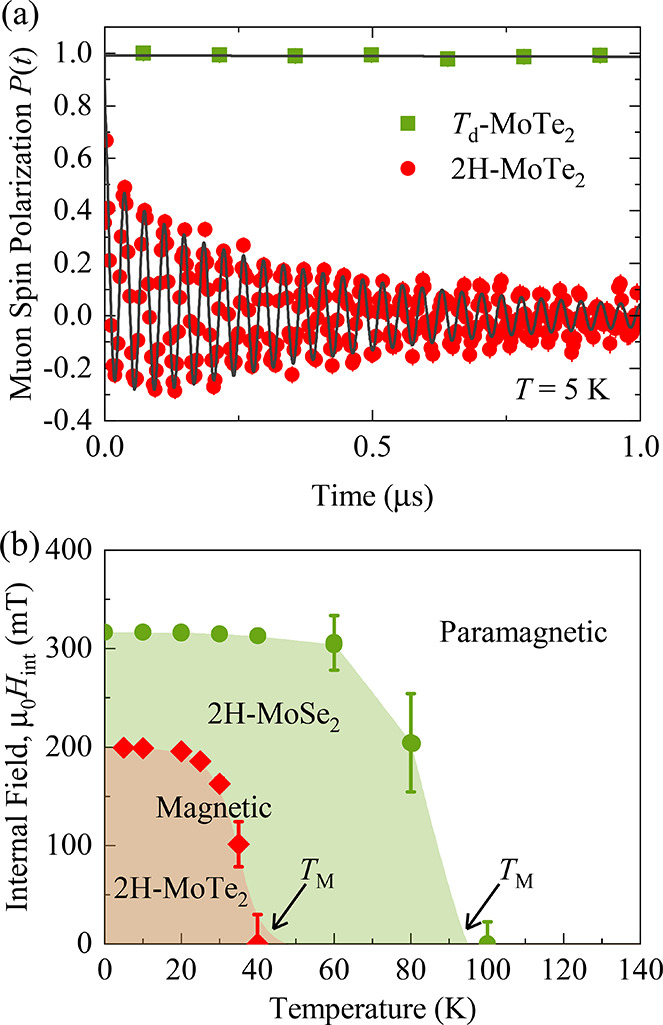
(a) ZF μSR time spectra for the single crystal samples of Td-MoTe2 and 2H-MoTe2 recorded at T = 5 K. Adapted with permission under a Creative Common CC BY license from ref (350). Copyright 2019 MDPI. (b) Temperature dependence of the internal field Hint of 2H-MoTe2, 2H-MoSe2 as a function of temperature. Adapted with permission under a Creative Common CC BY-NC 4.0 license from refs (382). Copyright 2019 AAAS.