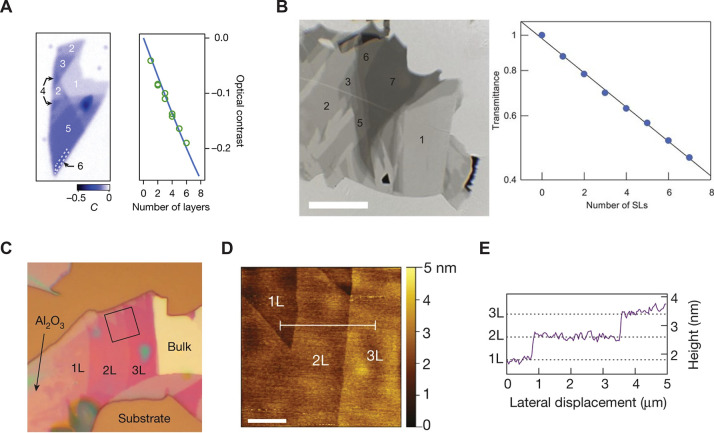
Figure 52.
Identification of exfoliated layer numbers. (A) Optical contrast map of a representative CrI3 flake (left) and the corresponding optical contrast per number of layers (right).5 Adapted with permission from ref (5). Copyright 2017 Springer Nature. (B) Left: Optical image of few-layer flakes of MnBi2Te4 exfoliated onto Al2O3. The corresponding layer number is labeled on selected flakes. The scale bar is 20 μm. Right: MnBi2Te4 transmittance versus layer number.111 Adapted with permission from ref (111). Copyright 2020 AAAS. (C) Optical image of few-layer Fe3GeTe2 flakes exfoliated onto Al2O3.12 (D) AFM image of the area in (C) marked by a solid black square.12 The scale bar is 2 μm. (E) Height profile plotted versus length along the white line in (D).12 Panels (C–E) are adapted with permission from ref (12). Copyright 2018 Springer Nature.

