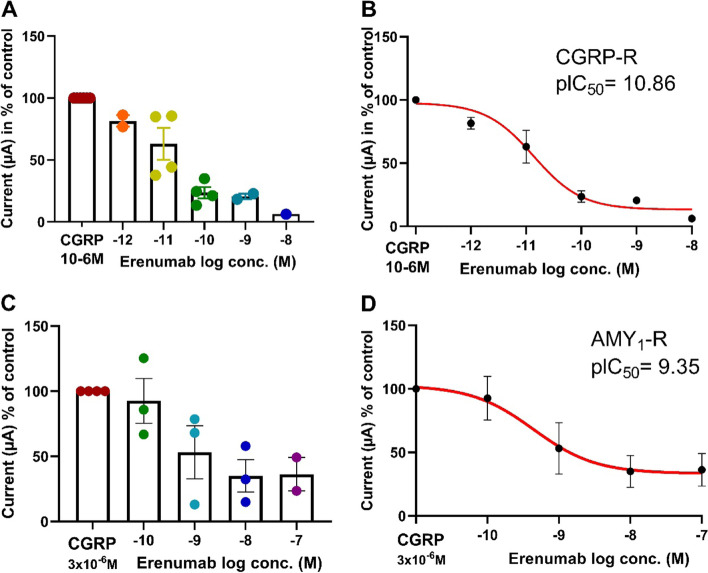
Fig. 5.
The experiments show the erenumab inhibition of CGRP induced currents in Xenopus Laevis oocytes expressing CGRP-R (A & B) and AMY1-R (C & D). In A-D, the currents induced by CGRP at each concentration of erenumab is given in % of the current obtained for CGRP without antagonist in 4-6 batches of oocytes. At a given concentration of erenumab in A & C each point represents the mean of 2-4 identical experiments in one batch of oocytes. In B & D the least square non-lin fit of the c-r relationship of log[erenumab] vs. response (three parameters) is shown for responses performed on CGRP-R (A) and AMY1-R (C). The 23 data points shown in Fig. A are obtained from experiments performed on 48 oocytes from six different batches. The same 23 data points are used for the curve fitting in B. The 15 data points shown in C are obtained from experiments performed on 37 oocytes from 4 different batches. The same 15 data points are used for the curve fitting in D

