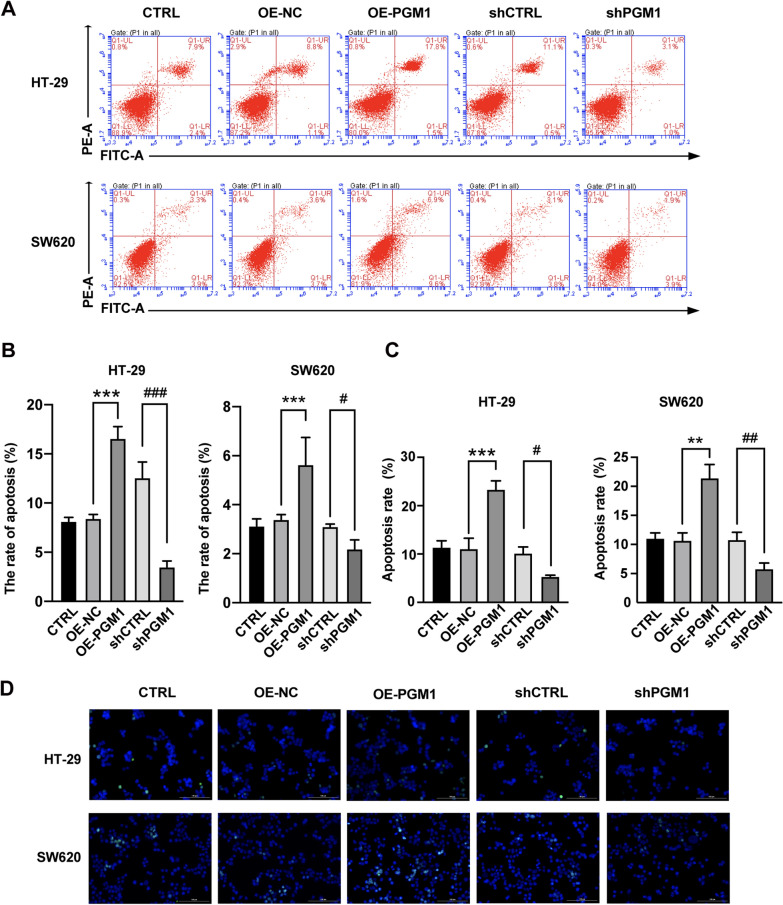
Fig. 5.
PGM1 promoted apoptosis. A, B The percentages of apoptotic cells in the different transfection groups (CTRL, OE-NC, OE-PGM1, shCTRL, and shPGM1) were determined by flow cytometry. The percentages of apoptotic cells in the five groups. Bars indicate the mean percentage ± SD. C, D TUNEL assays for apoptotic HT-29 and SW620 cells in the CTRL, OE-NC, OE-PGM1, shCTRL, and shPGM1 groups (scale bar = 100 μm). HE: hematoxylin–eosin, *P < 0.05, **P < 0.01, ***P < 0.001; #P < 0.05, ##P < 0.01, ###P < 0.001

