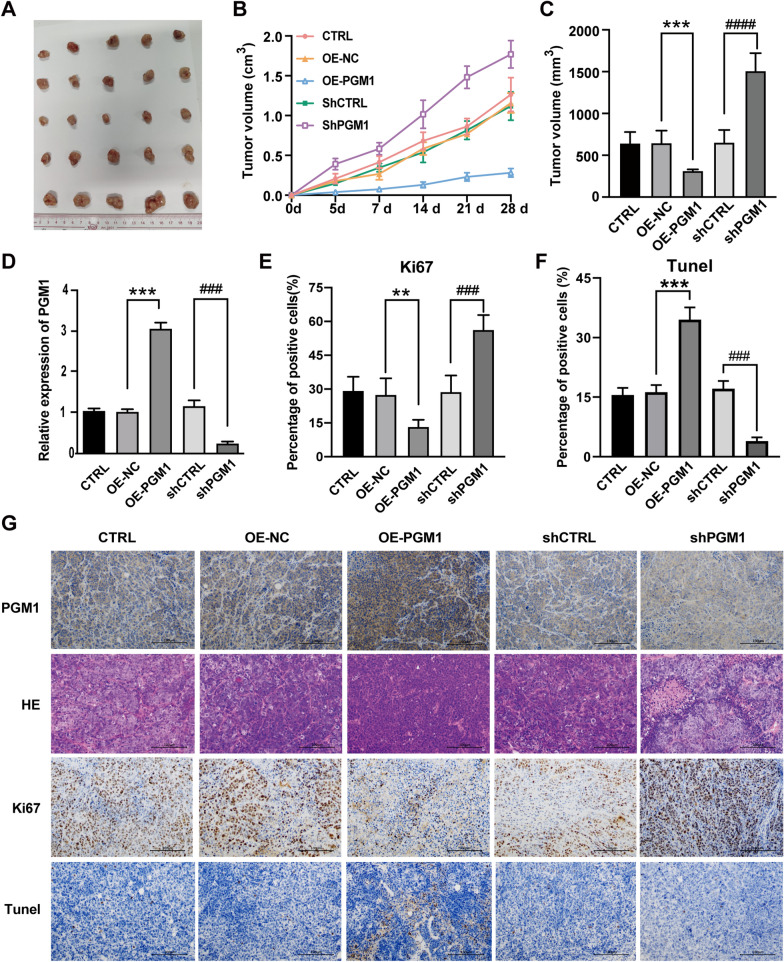
Fig. 8.
Downregulation of PGM1 accelerated tumor growth in vivo. A Tumors formed at 6 weeks post-injection (n = 5/group). Tumors in the CTRL, OE-NC, OE-PGM1, shCTRL and shPGM1 groups were removed upon completion of the study. B Tumor growth in the 5 groups was assessed by measurements of tumor volume over time (mean ± SD; n = 25). **P < 0.01. Mice were anesthetized and sacrificed at experimental endpoints. The tumors were subsequently dissected. C Tumor volume was monitored in the five aforementioned groups at the endpoints in each experiment. D PGM1 mRNA expression in tumors from the CTRL, OE-NC, OE-PGM1, shCTRL, and shPGM1 groups; n = 5. E Representative images of PGM1 IHC, H&E, Ki67, and TUNEL staining in the CTRL, OE-NC, OE-PGM1, shCTRL, and shPGM1 groups, respectively. (×200, scale bars = 100 µm). **P < 0.01, ***P < 0.001; ###P < 0.001, ####P < 0.0001

