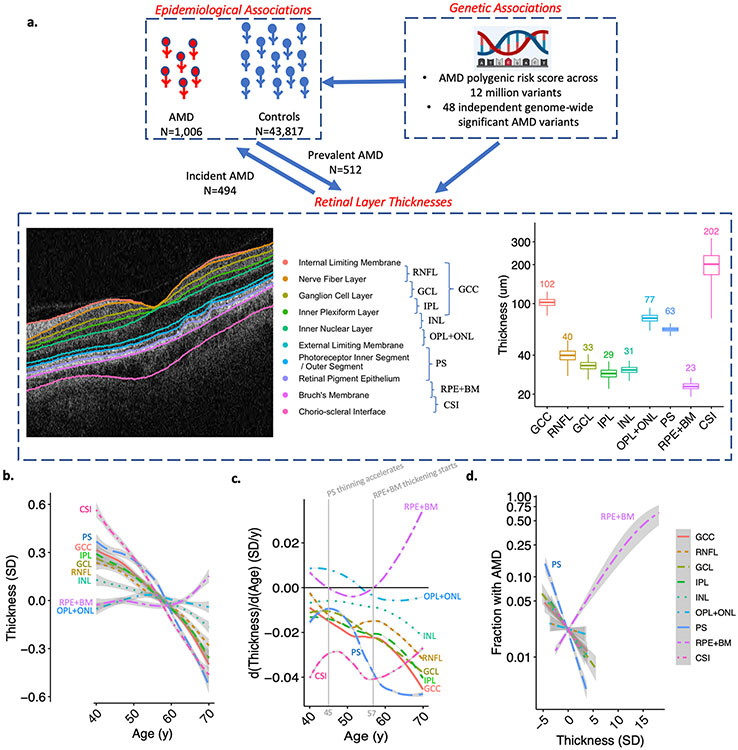
Figure 1: Study schema, distributions of retinal layer thicknesses and their association with age and AMD.
(a) This study performed epidemiological associations of 9 retinal layer thicknesses with prevalent and incident AMD, and also genetic associations of an AMD polygenic risk score across 20 million variants, and across 48 independent genome-wide significant AMD variants from Fritsche et al. Nature Genetics 2016. Distribution of retinal layer thicknesses in micro-meters is displayed to the right of the retinal layer schematic. (b) Association of age with retinal layer thickness. Curves and standard errors reflect the best-fit generalized additive model (gam) to the individual-level data, with added smoothness. (c) Change in thickness by age for each retinal layer, plot was developed by taking the derivative (dThickness/dAge) of the plot in panel (b). Solid vertical gray line represents the age at which PS thinning accelerates (45y), and the age at which RPE+BM thickening starts (57y) across the population. (d) Association of retinal layer thickness with AMD across 9 layers. GCC = ganglion cell complex, RNFL = retinal nerve fiber layer, GCL = ganglion cell layer, IPL = inner plexiform layer, INL = inner nuclear layer, OPL+ONL = outer plexiform layer, PS = photoreceptor segment layer, RPE+BM = retinal pigment epithelium plus Bruch’s membrane, CSI = choroid scleral interface.

