
Fig. 1.
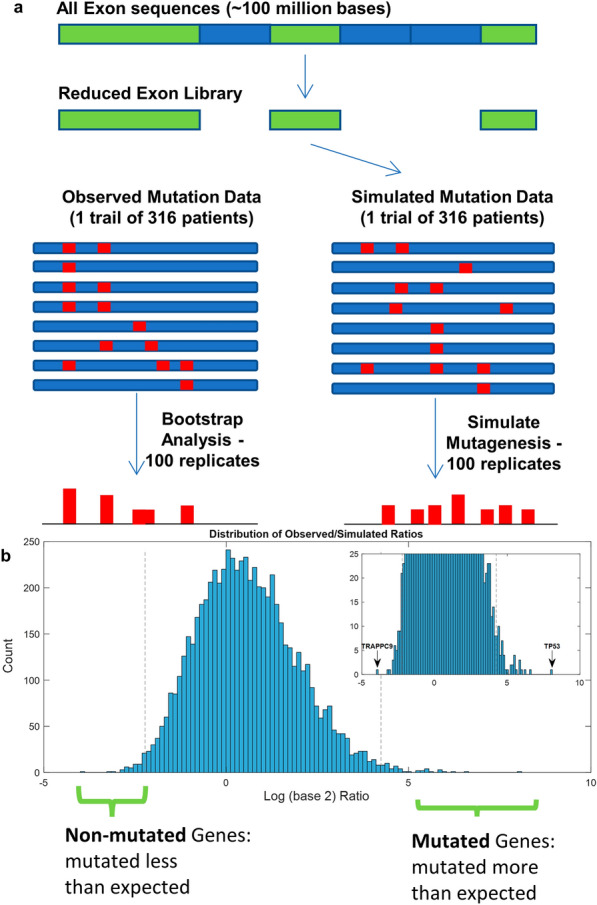
Identifying non-mutated genes. a Schematic of mutagenesis simulation. To approximate the data used in the patient exome sequencing, a reduced exon library was used consisting of the exons approximating those used in the TCGA trial. Simulated mutagenesis depicted as red lines is subjected to repeated trials using the observed background mutation frequencies. The mutation frequencies are then compared between the simulated and observed data. b Log ratio distribution of observed/simulated data. The inset limits the y-axis to 25 to see the distribution at the tails more clearly; the genes that are most extreme are labelled. Gray dashed lines show the top 50 non-mutated genes and top 50 mutated genes that are used for subsequent analysis (corresponding to the values less than 0.007 quantile and greater than the 99.23 quantile of the dataset)