
Fig. 4.
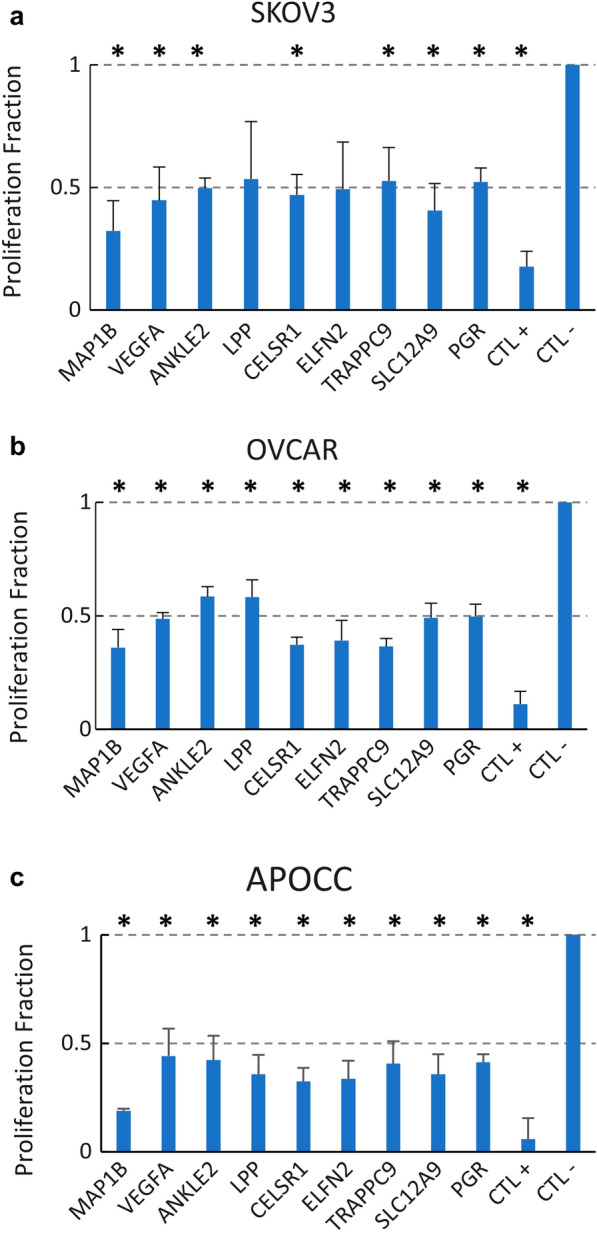
Cell proliferation after selected gene knockdown in three different ovarian cancer cell lines: SKOV3 (a), OVCAR (b) and APOCC (c). Fraction of cell viability is standardized against the negative control (CTL-) proliferation levels and the error bars are the standard deviations from three replicates. A reference line is drawn through 0.5 showing that almost all genes in all tested cell lines reduced cell proliferation by at least 50%. Asterisks denote significant differences (p-value < 0. 05) between the gene knockdown and the negative control