Fig. 5.
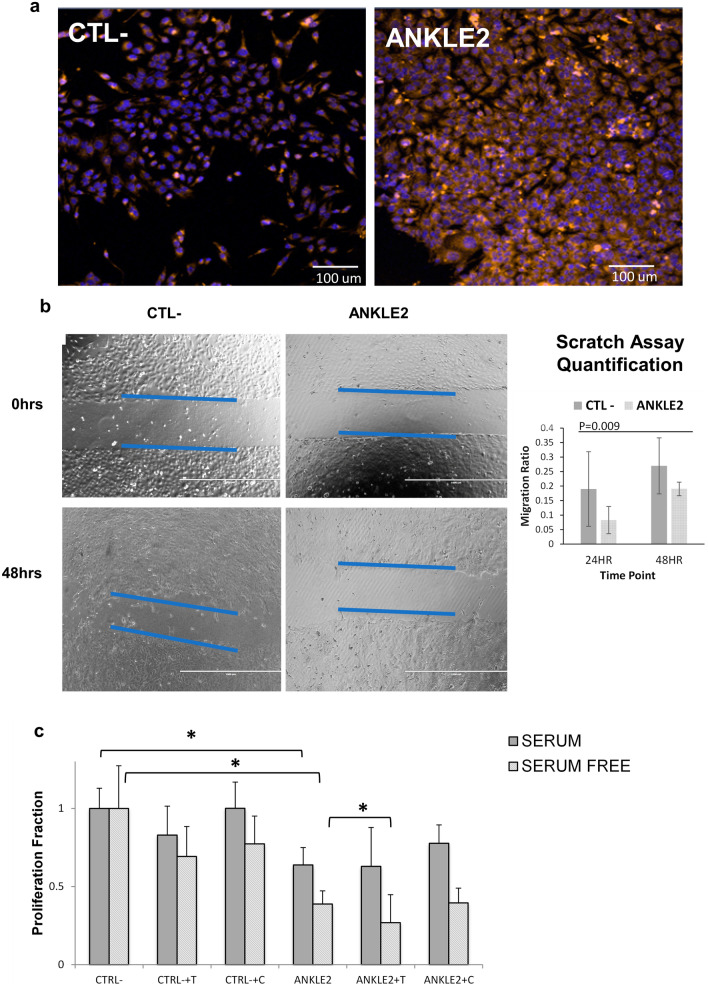
ANKLE2 knockdown in SKOV3 cell line. a Representative fluorescent images of microscopic imaging of SKOV3 after ANKLE2 and CTL- knockdowns. b Migration assay for SKOV3 after knockdown with selected genes. Images at the top were taken just after the scratch while the lower images were taken after 48 h. The blue lines denote the margins of the scratch. The white horizontal line is 200 µm. The chart to the right shows quantification of the migration normalized to the negative control at two different time points. The p-value (P) of a pairwise t-test combining the differences at the 24HR and 48HR time points is shown in the chart. c Chemosensitivity of CTL- (negative control) and ANKLE2 knockdown in SKOV3 cells with and without paclitaxel/taxol (T) and carboplatin (C) in serum containing and serum free media. Errors bars are the standard error of the mean of three replicates. Values are normalized to the negative control (CTL-). Asterisks denote significant differences between the indicated pairs

