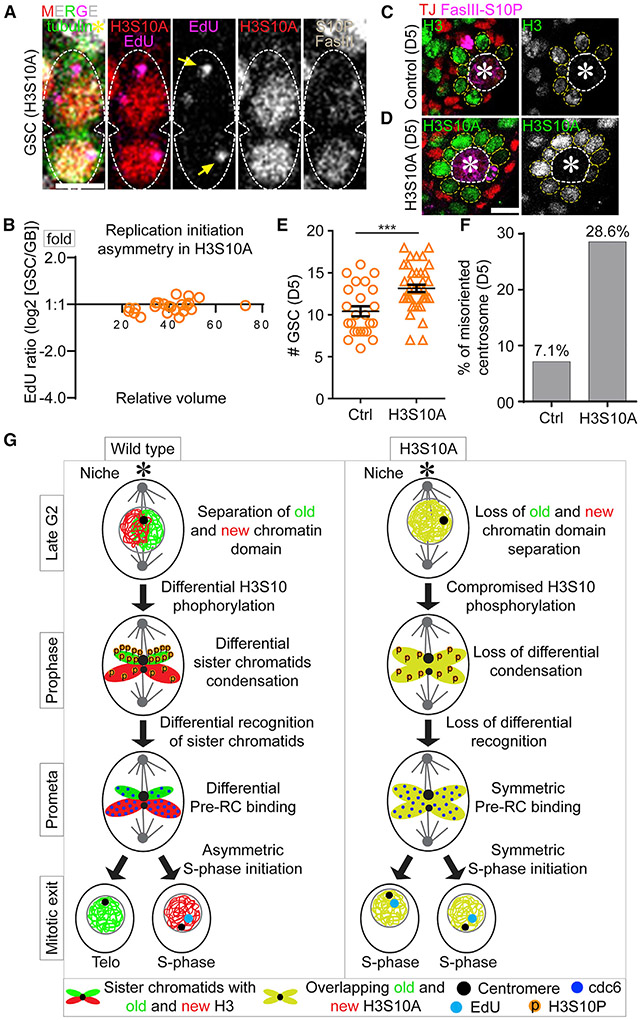
Figure 7. Expression of H3S10A induces synchronous S-phase initiation of GSC-GB pair nuclei and results in several GSC defects.
(A) Comparable EdU levels and patterns in a late telophase GSC to G1-to-early S phase GSC-GB pair nuclei.
(B) Quantification of EdU levels in GSC-GB pair nuclei resulting from ACD of GSCs shows synchronous replication initiation (n = 25, Table S18, see Mendeley data).
(C and D) Immunofluorescent images at the testis tip show increased GSCs 5 days (D5) after shifting flies from permissive to restrictive temperature for Gal80ts to turn on nanos-Gal4 to express H3S10A
(D), compared with D5 after expressing the control H3 (C).
(E) Quantification of the number of GSCs in testes D5 after expressing either the control H3 or the H3S10A (Ctrl = 10.41 ± 0.51 [n = 29]; H3S10A = 13.16 ±0.44 [n = 38]); ***p = 0.0002, Mann Whitney test.
(F) Quantification of the percentage of GSCs with misoriented centrosome D5 after expressing either the control H3 or H3S10A (Ctrl = 7.1% [n = 463]; H3S10A = 28.6% [n = 329]).
(G) Models for the role of differential condensation of old and new histone enriched sister chromatids in driving asynchronous S-phase entry of the GSC-GB pair nuclei in wild-type H3- but not in the H3S10A-expressing GSCs. Scale bars, 5 μm. Asterisk: hub. All ratios = average ± SE.

