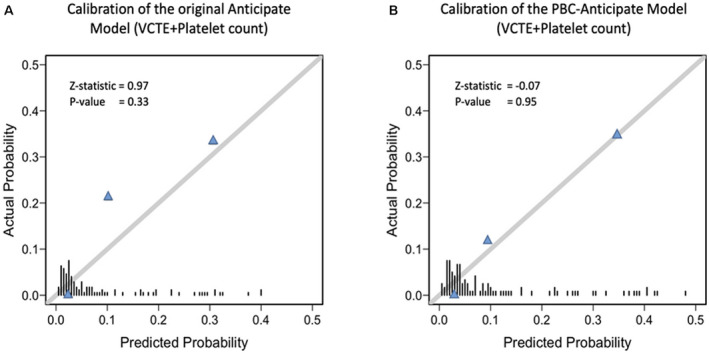
FIG. 4.

Performance (in terms of calibration) of the original ANTICIPATE model and the ANTICIPATE‐PBC model in predicting VNT. (A) Calibration plot of the original ANTICIPATE model. This model underpredicted the risk of VNT in the segment of patients with a risk of between 5% and 20%. (B) Calibration plot of the ANTICIPATE‐PBC model, which shows excellent agreement between the predicted and observed probabilities of VNT. The bars over the x‐axis show the distribution of the patients according to predicted risks. Z‐value represents the Spiegelhalter calibration( 20 ) with its P value. The closer the value of the Z‐statistic to zero, and the higher its P value, the better the calibration of the model.
