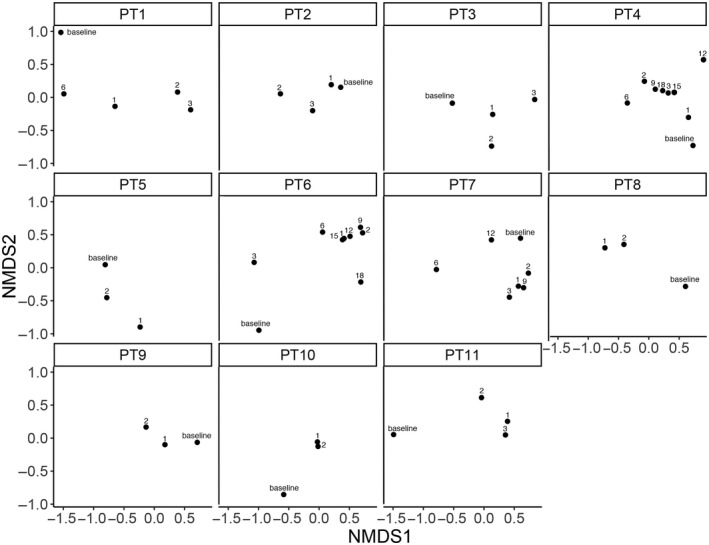
FIG. 1.

Nonmetric multidimensional scaling (NMDS) ordination plots on Bray‐Curtis distance computed after data normalization using the variance‐stabilizing transformation. Each plot shows treatment time points (indicated by labels) for an individual patient.
