FIG. 5.

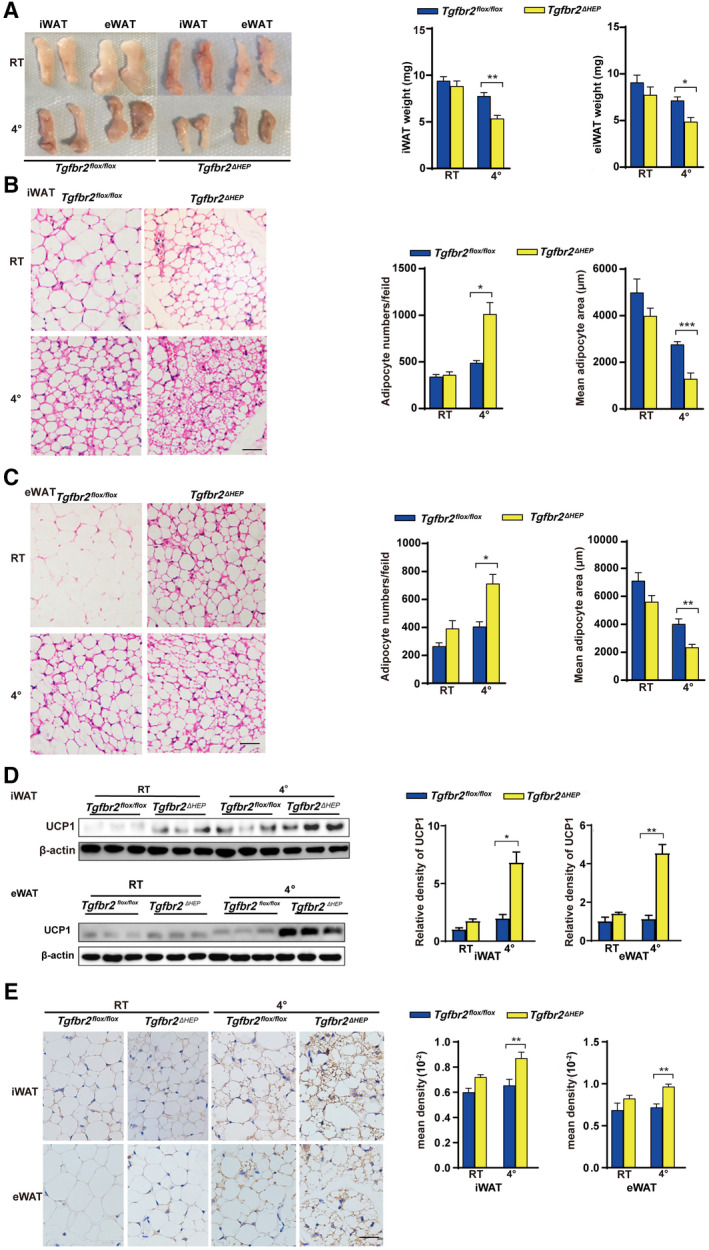
Tgfbr2 ablation in hepatocytes promotes apparent WAT browning after cold exposure. Mice were exposed to 4℃ and RT (22℃) for 7 days; n = 5 per group. (A) Fat mass and fat weight in cold‐exposed mice. (B,C) Representative images of H&E‐stained iWAT and eWAT sections in cold‐exposed mice (×400; black bar indicates 5 μm) and the corresponding adipocyte number/per field and the mean adipocyte area of iWAT and eWAT sections (two sections from each mouse, with three mice in each group). (D) UCP1 expression in iWAT and eWAT determined by Western blot. (E) Representative images of iWAT and eWAT sections stained with anti‐UCP1 (×400; black bar indicates 10 μm) and the corresponding mean density of iWAT and eWAT sections. Two‐way ANOVA was used for all statistical analysis. Data are represented as the mean ± SEM (*P < 0.05 and **P < 0.01). Tgfbr2ΔHEP ‐ RT versus Tgfbr2flox/flox ‐RT and Tgfbr2ΔHEP ‐4℃ versus Tgfbr2flox/flox ‐4℃ were examined.
