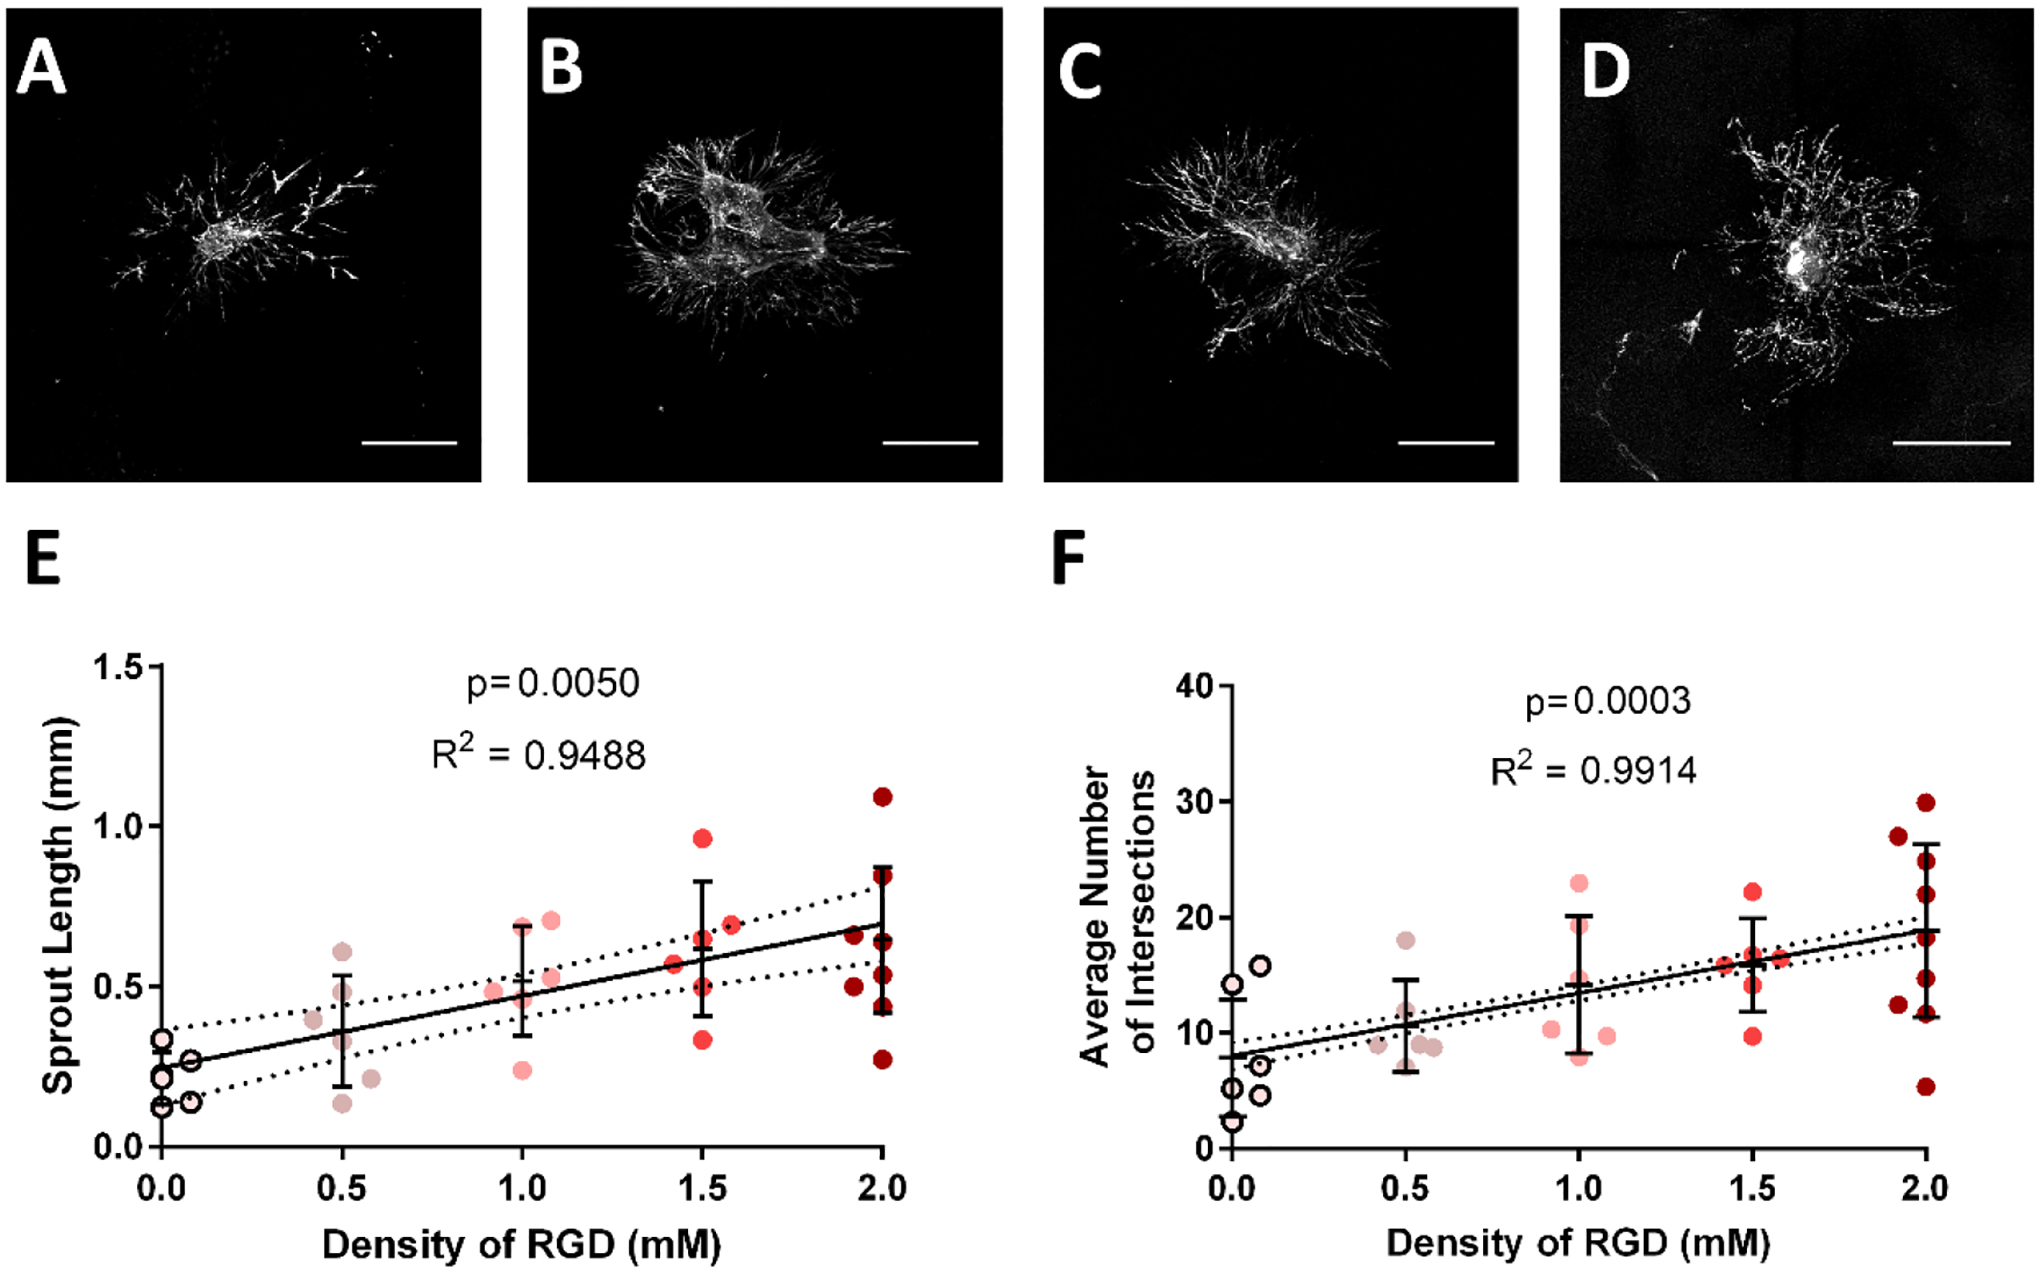
Figure 4:

Sprouting intersections and length increases with increasing concentration of RGD in fully degradable, 10% PEG hydrogels. Representative images of collecting vessel segments labeled with Calcein-AM at day 7 cultured in (A) 0.5 mM RGD, (B) 1.0 mM RGD, (C) 1.5 mM RGD and (D) 2.0 mM RGD conditions. Scale bar = 500 μm. There was no significant change in (E) sprout length or (F) average number of intersections at tested concentrations above 0.0 mM RGD. Each point represents a biologically independent sample (sample size: 0.0 mM RGD = 6, 0.5 mM RGD = 6, 1.0 mM RGD = 6, 1.5 mM RGD = 6, 2.0 mM RGD = 11). Linear regression shows the dependency of sprout length and average number of intersections on RGD density. Dotted lines above and below the regression represent 95% confidence intervals and the p-values reflect the results of an F-test to determine the significance of a non-zero slope. * p<0.05, ** p<0.01
