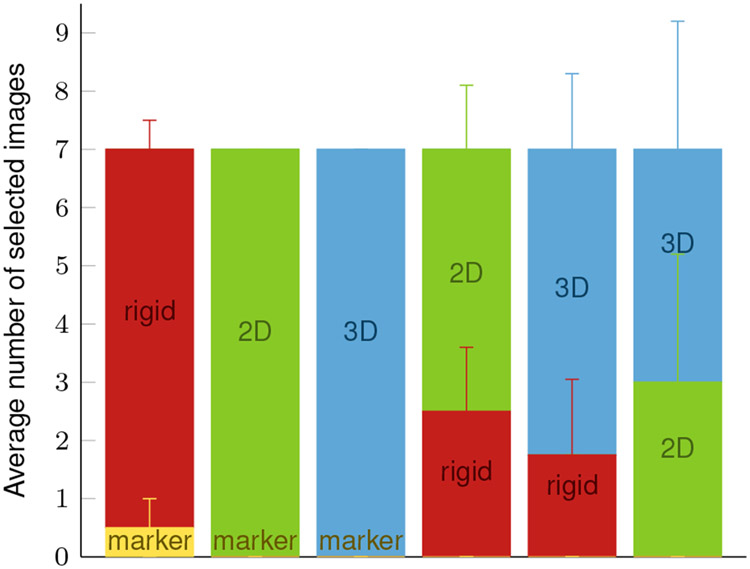
Fig. 6:
Results of the user study averaged over all four raters with standard deviation. The six bar plots refer to the comparison between two motion compensation methods each (yellow: marker-based, red: rigid IMU-based, green: 2D non-rigid IMU-based, blue: 3D non-rigid IMU-based). Each rater was shown seven image pairs per method comparison. The bar height shows how many times the raters on average chose a method over the other.

